Copyright
©The Author(s) 2025.
World J Psychiatry. Apr 19, 2025; 15(4): 100289
Published online Apr 19, 2025. doi: 10.5498/wjp.v15.i4.100289
Published online Apr 19, 2025. doi: 10.5498/wjp.v15.i4.100289
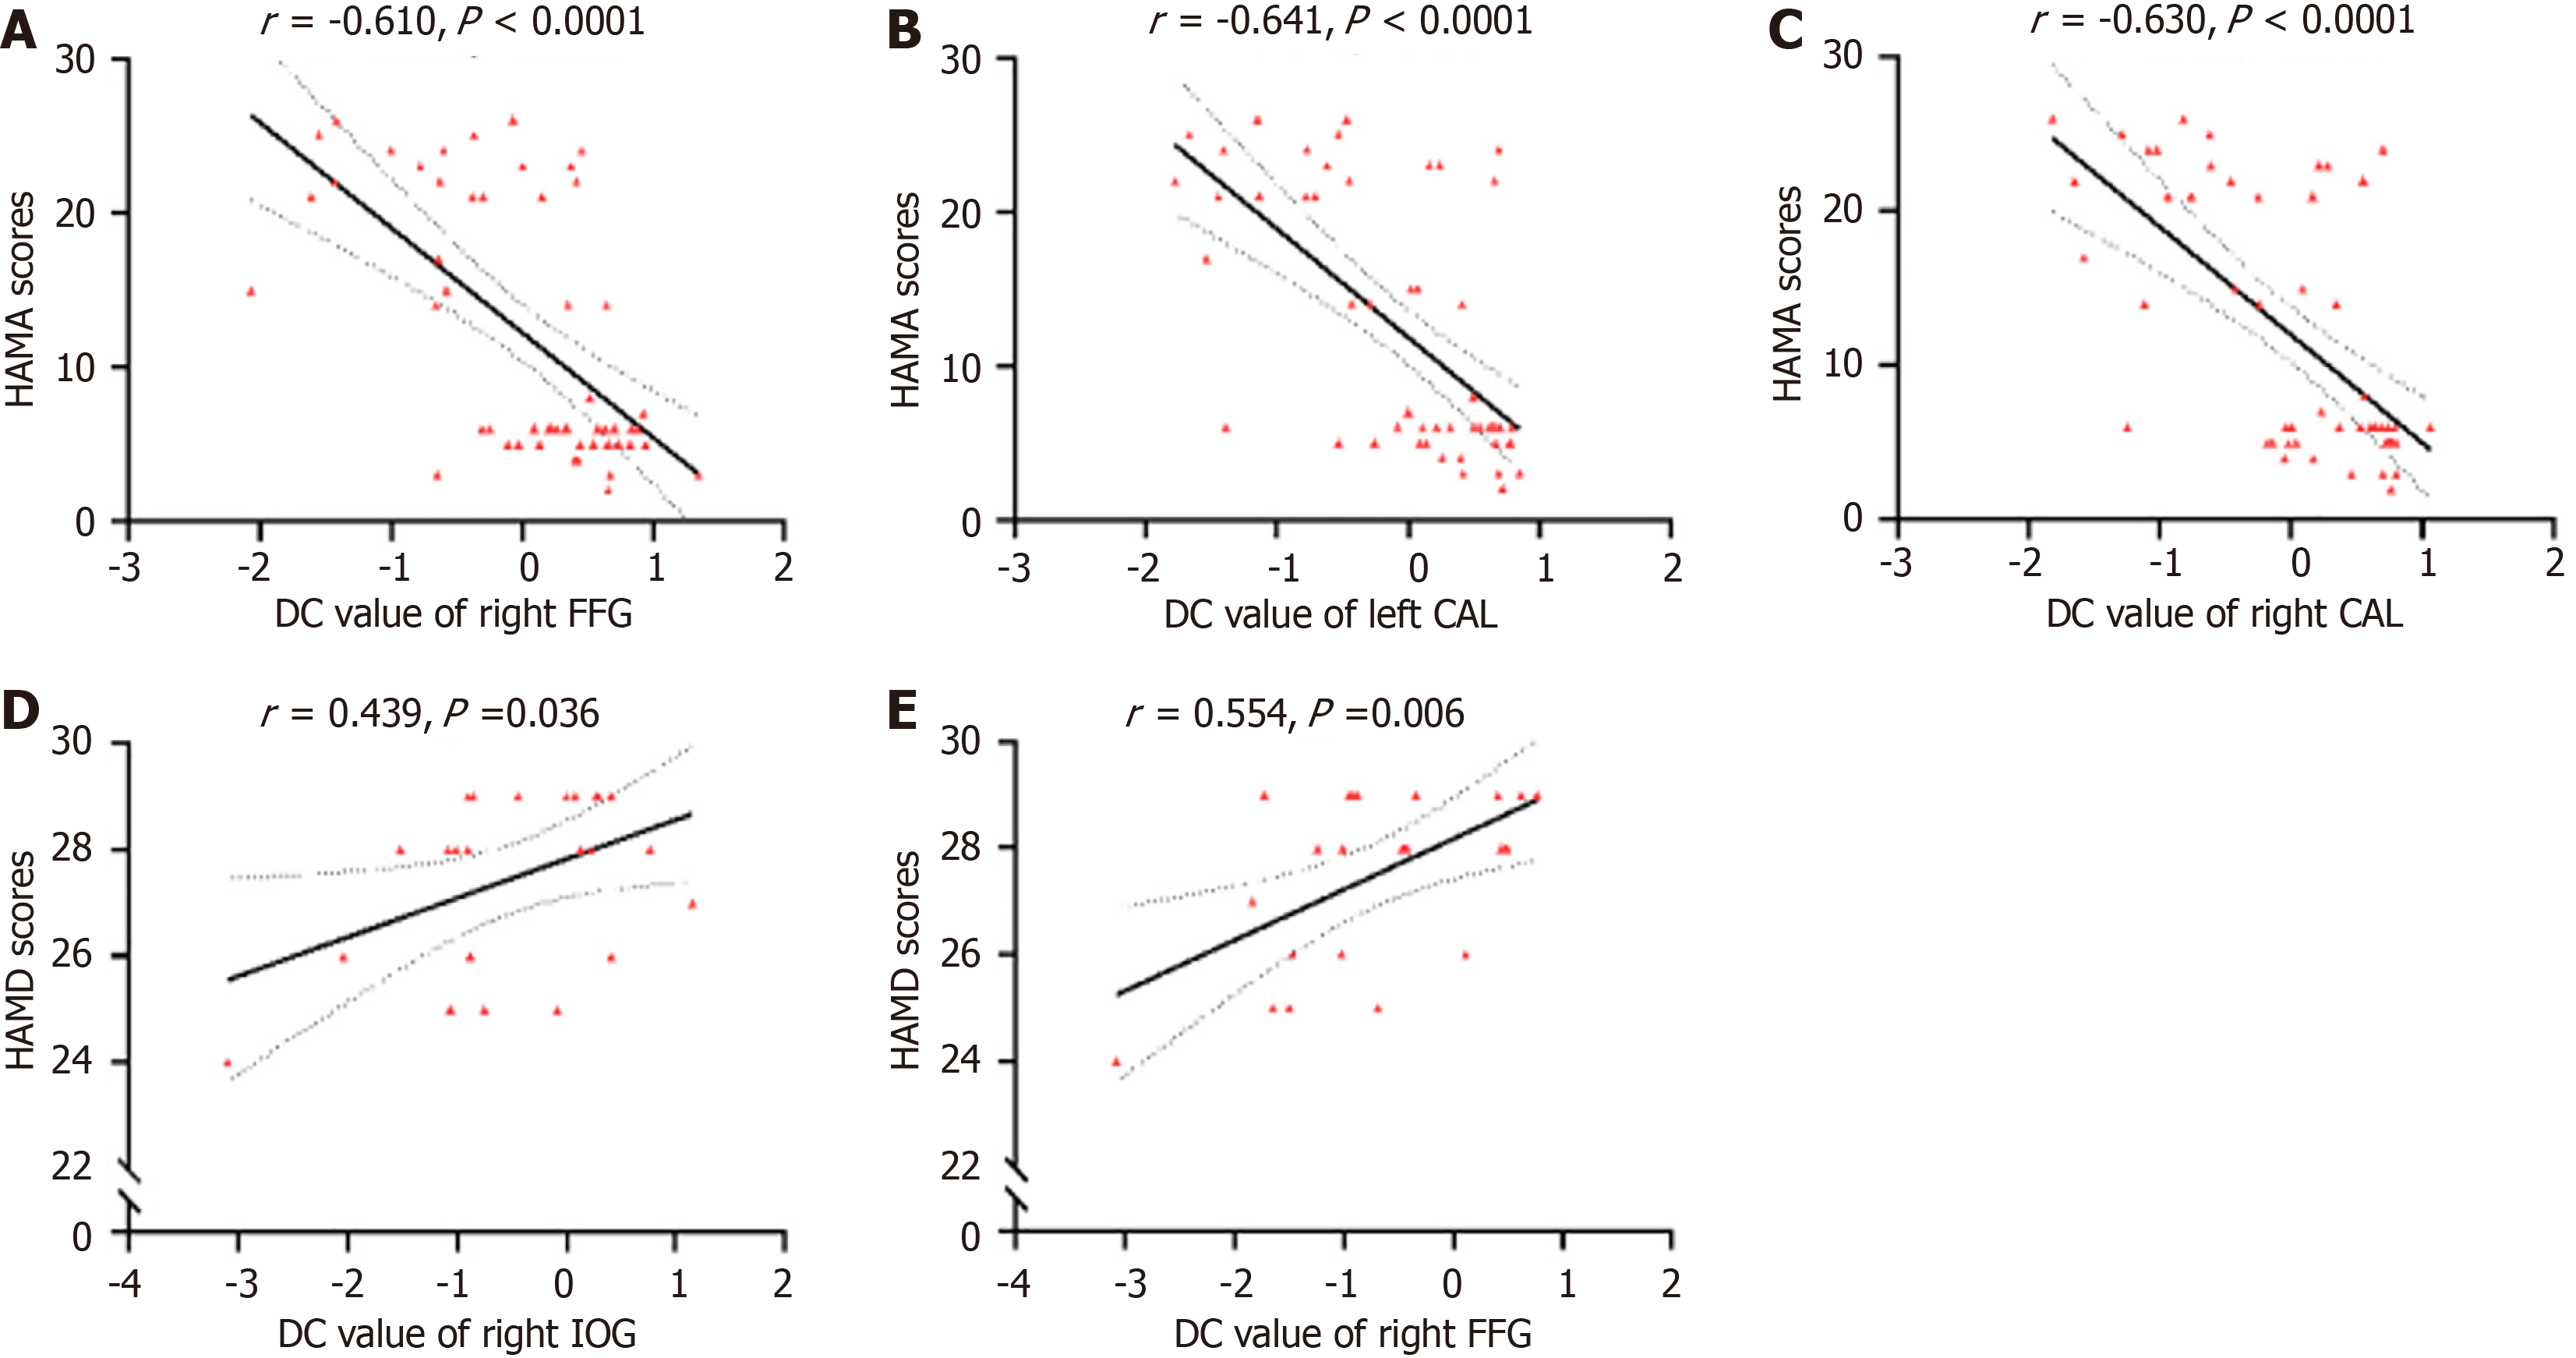
Figure 3 Correlation analysis between structural abnormalities and clinical symptoms.
A: Negative correlation between degree centrality (DC) values of the right fusiform gyrus (FFG) and Hamilton anxiety rating scale (HAMA) scores in major depressive disorder (MDD) patients; B: Negative correlation between DC values of the left calcarine (CAL) and HAMA scores in MDD patients; C: Negative correlation between DC values of the right CAL and HAMA scores in MDD patients; D: Positive correlation between DC values of the right inferior occipital gyrus and Hamilton depression rating scale (HAMD) scores in anxious MDD patients; E: Positive correlation between DC values of the right FFG and HAMD scores in anxious MDD patients. DC: Degree centrality; FFG: Fusiform gyrus; CAL: Calcarine; HAMD: Hamilton depression rating scale; HAMA: Hamilton anxiety rating scale.
- Citation: Gao YJ, Meng LL, Lu ZY, Li XY, Luo RQ, Lin H, Pan ZM, Xu BH, Huang QK, Xiao ZG, Li TT, Yin E, Wei N, Liu C, Lin H. Degree centrality values in the left calcarine as a potential imaging biomarker for anxious major depressive disorder. World J Psychiatry 2025; 15(4): 100289
- URL: https://www.wjgnet.com/2220-3206/full/v15/i4/100289.htm
- DOI: https://dx.doi.org/10.5498/wjp.v15.i4.100289


