Copyright
©The Author(s) 2025.
World J Psychiatry. Apr 19, 2025; 15(4): 100289
Published online Apr 19, 2025. doi: 10.5498/wjp.v15.i4.100289
Published online Apr 19, 2025. doi: 10.5498/wjp.v15.i4.100289
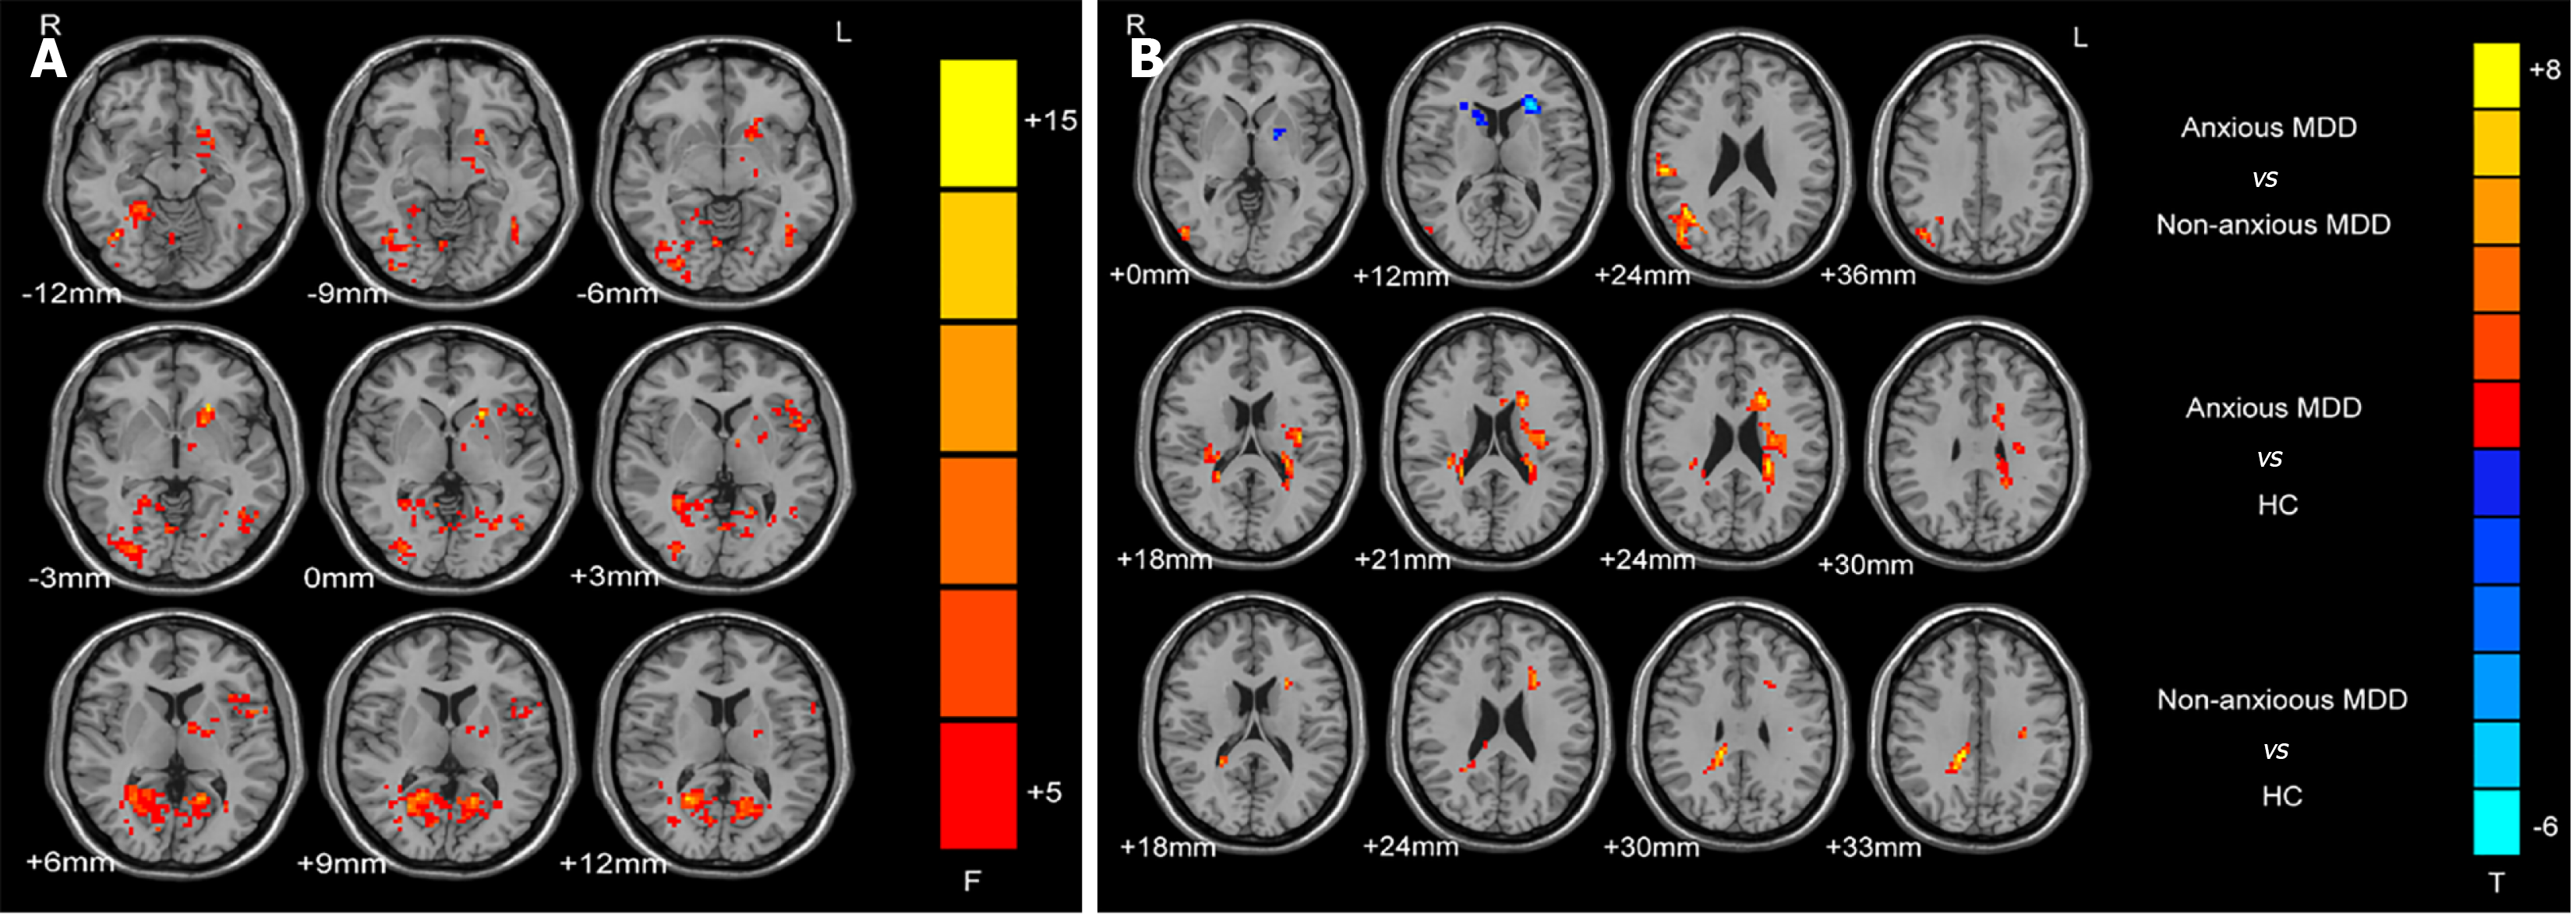
Figure 2 Between-group differences in degree centrality.
A: Brain regions showing differences of degree centrality (DC) values among the three groups; B: Brain regions showing DC value differences in pairwise-compared groups. DC: Degree centrality; ANCOVA: Analysis of covariance; MDD: Major depressive disorder; HC: Healthy control; DC: Degree centrality.
- Citation: Gao YJ, Meng LL, Lu ZY, Li XY, Luo RQ, Lin H, Pan ZM, Xu BH, Huang QK, Xiao ZG, Li TT, Yin E, Wei N, Liu C, Lin H. Degree centrality values in the left calcarine as a potential imaging biomarker for anxious major depressive disorder. World J Psychiatry 2025; 15(4): 100289
- URL: https://www.wjgnet.com/2220-3206/full/v15/i4/100289.htm
- DOI: https://dx.doi.org/10.5498/wjp.v15.i4.100289


