Copyright
©The Author(s) 2025.
World J Psychiatry. Mar 19, 2025; 15(3): 102571
Published online Mar 19, 2025. doi: 10.5498/wjp.v15.i3.102571
Published online Mar 19, 2025. doi: 10.5498/wjp.v15.i3.102571
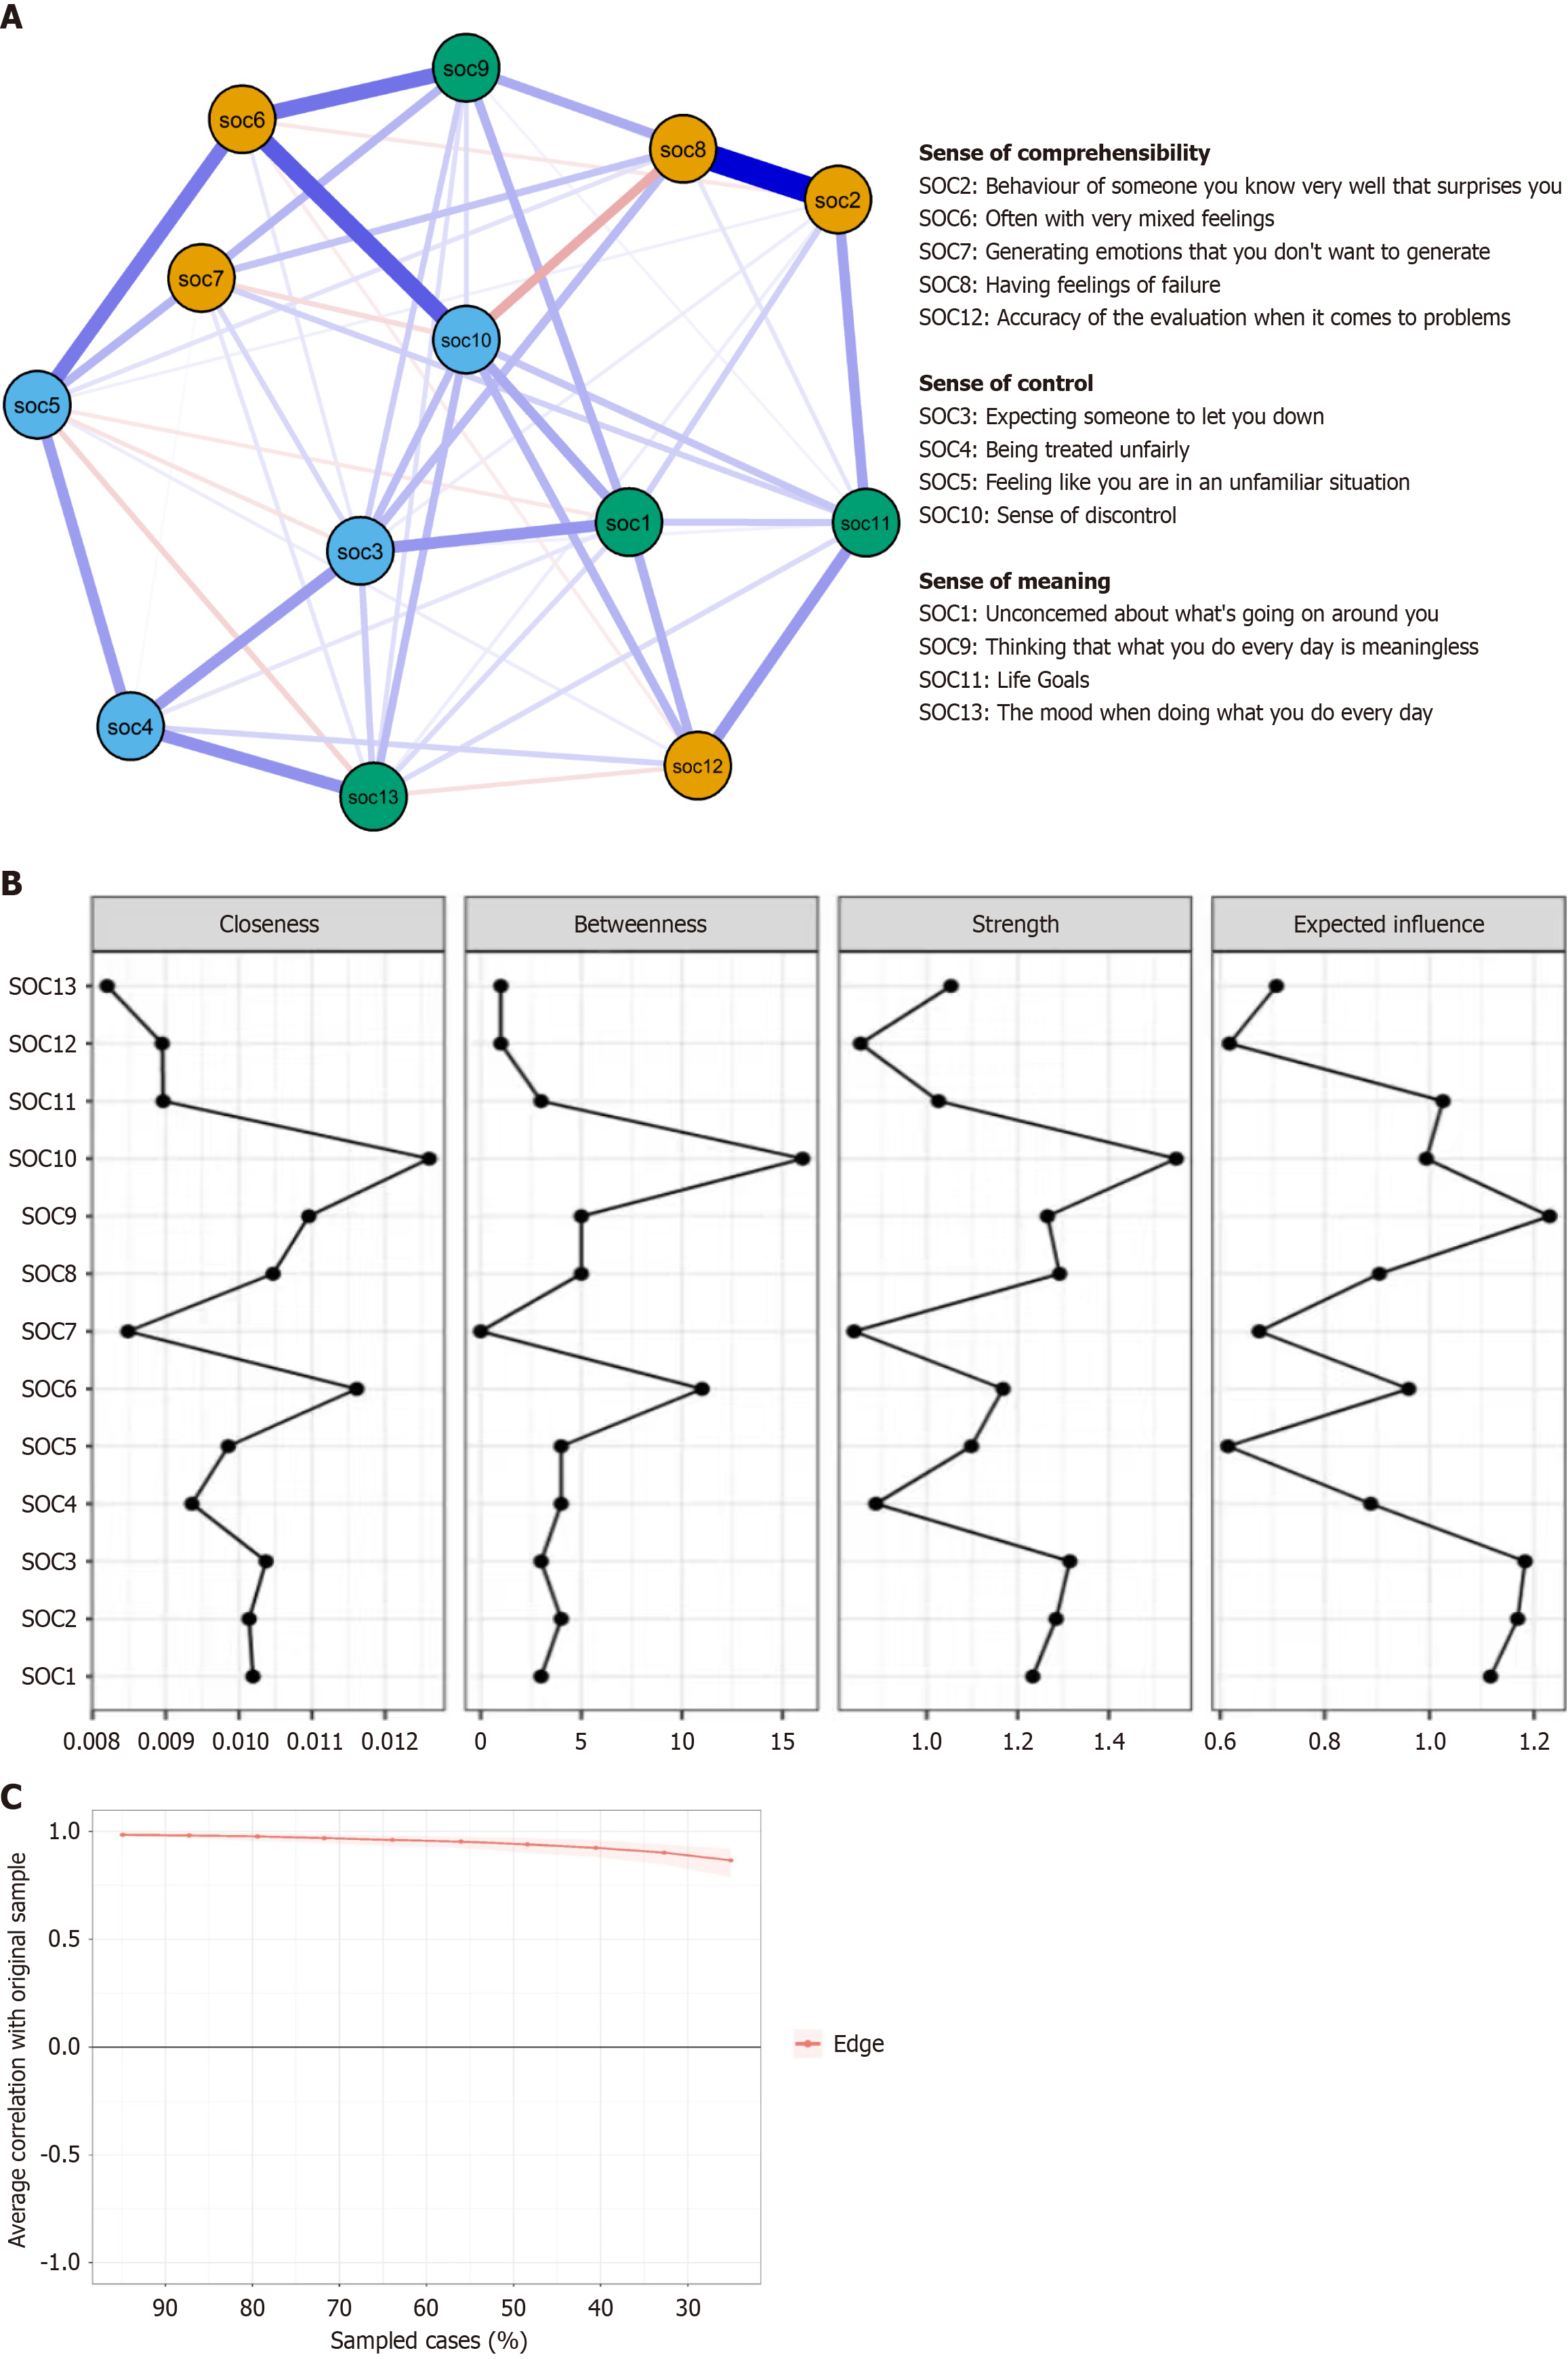
Figure 1 Network structure diagram of sense of coherence scale-13 symptoms in patients after percutaneous coronary intervention.
A: Symptoms network of sense of coherence scale-13 (SOC-13) in patients after percutaneous coronary intervention (PCI). The edge between the two connected nodes represented their association strength. Wherein, the blue indicated positive association, red showed negative correlation. And the shorter and darker the edges were, the stronger their association were; B: Centrality analysis of SOC-13 symptoms in patients after PCI. Closeness is the inverse of the sum of the shortest path distances from all other nodes to that node, betweenness is the frequency of a node being on the shortest paths of any two other nodes, and strength is the sum of the weighted values of all the connecting lines of a node. The higher the score of point degree centrality of a symptom, the more central the symptom is in the network, i.e., it is the core symptom in the network; C: Stability coefficients for the expected impact of symptoms. The stability coefficient for the expected impact of symptoms was > 50, representing the model was stable. SOC: Sense of coherence.
- Citation: Li Y, Wang LH, Zeng H, Zhao Y, Lu YQ, Zhang TY, Luo HB, Tang F. Psychological consistency network characteristics and influencing factors in patients after percutaneous coronary intervention treatment. World J Psychiatry 2025; 15(3): 102571
- URL: https://www.wjgnet.com/2220-3206/full/v15/i3/102571.htm
- DOI: https://dx.doi.org/10.5498/wjp.v15.i3.102571


