Copyright
©The Author(s) 2025.
World J Psychiatry. Mar 19, 2025; 15(3): 102567
Published online Mar 19, 2025. doi: 10.5498/wjp.v15.i3.102567
Published online Mar 19, 2025. doi: 10.5498/wjp.v15.i3.102567
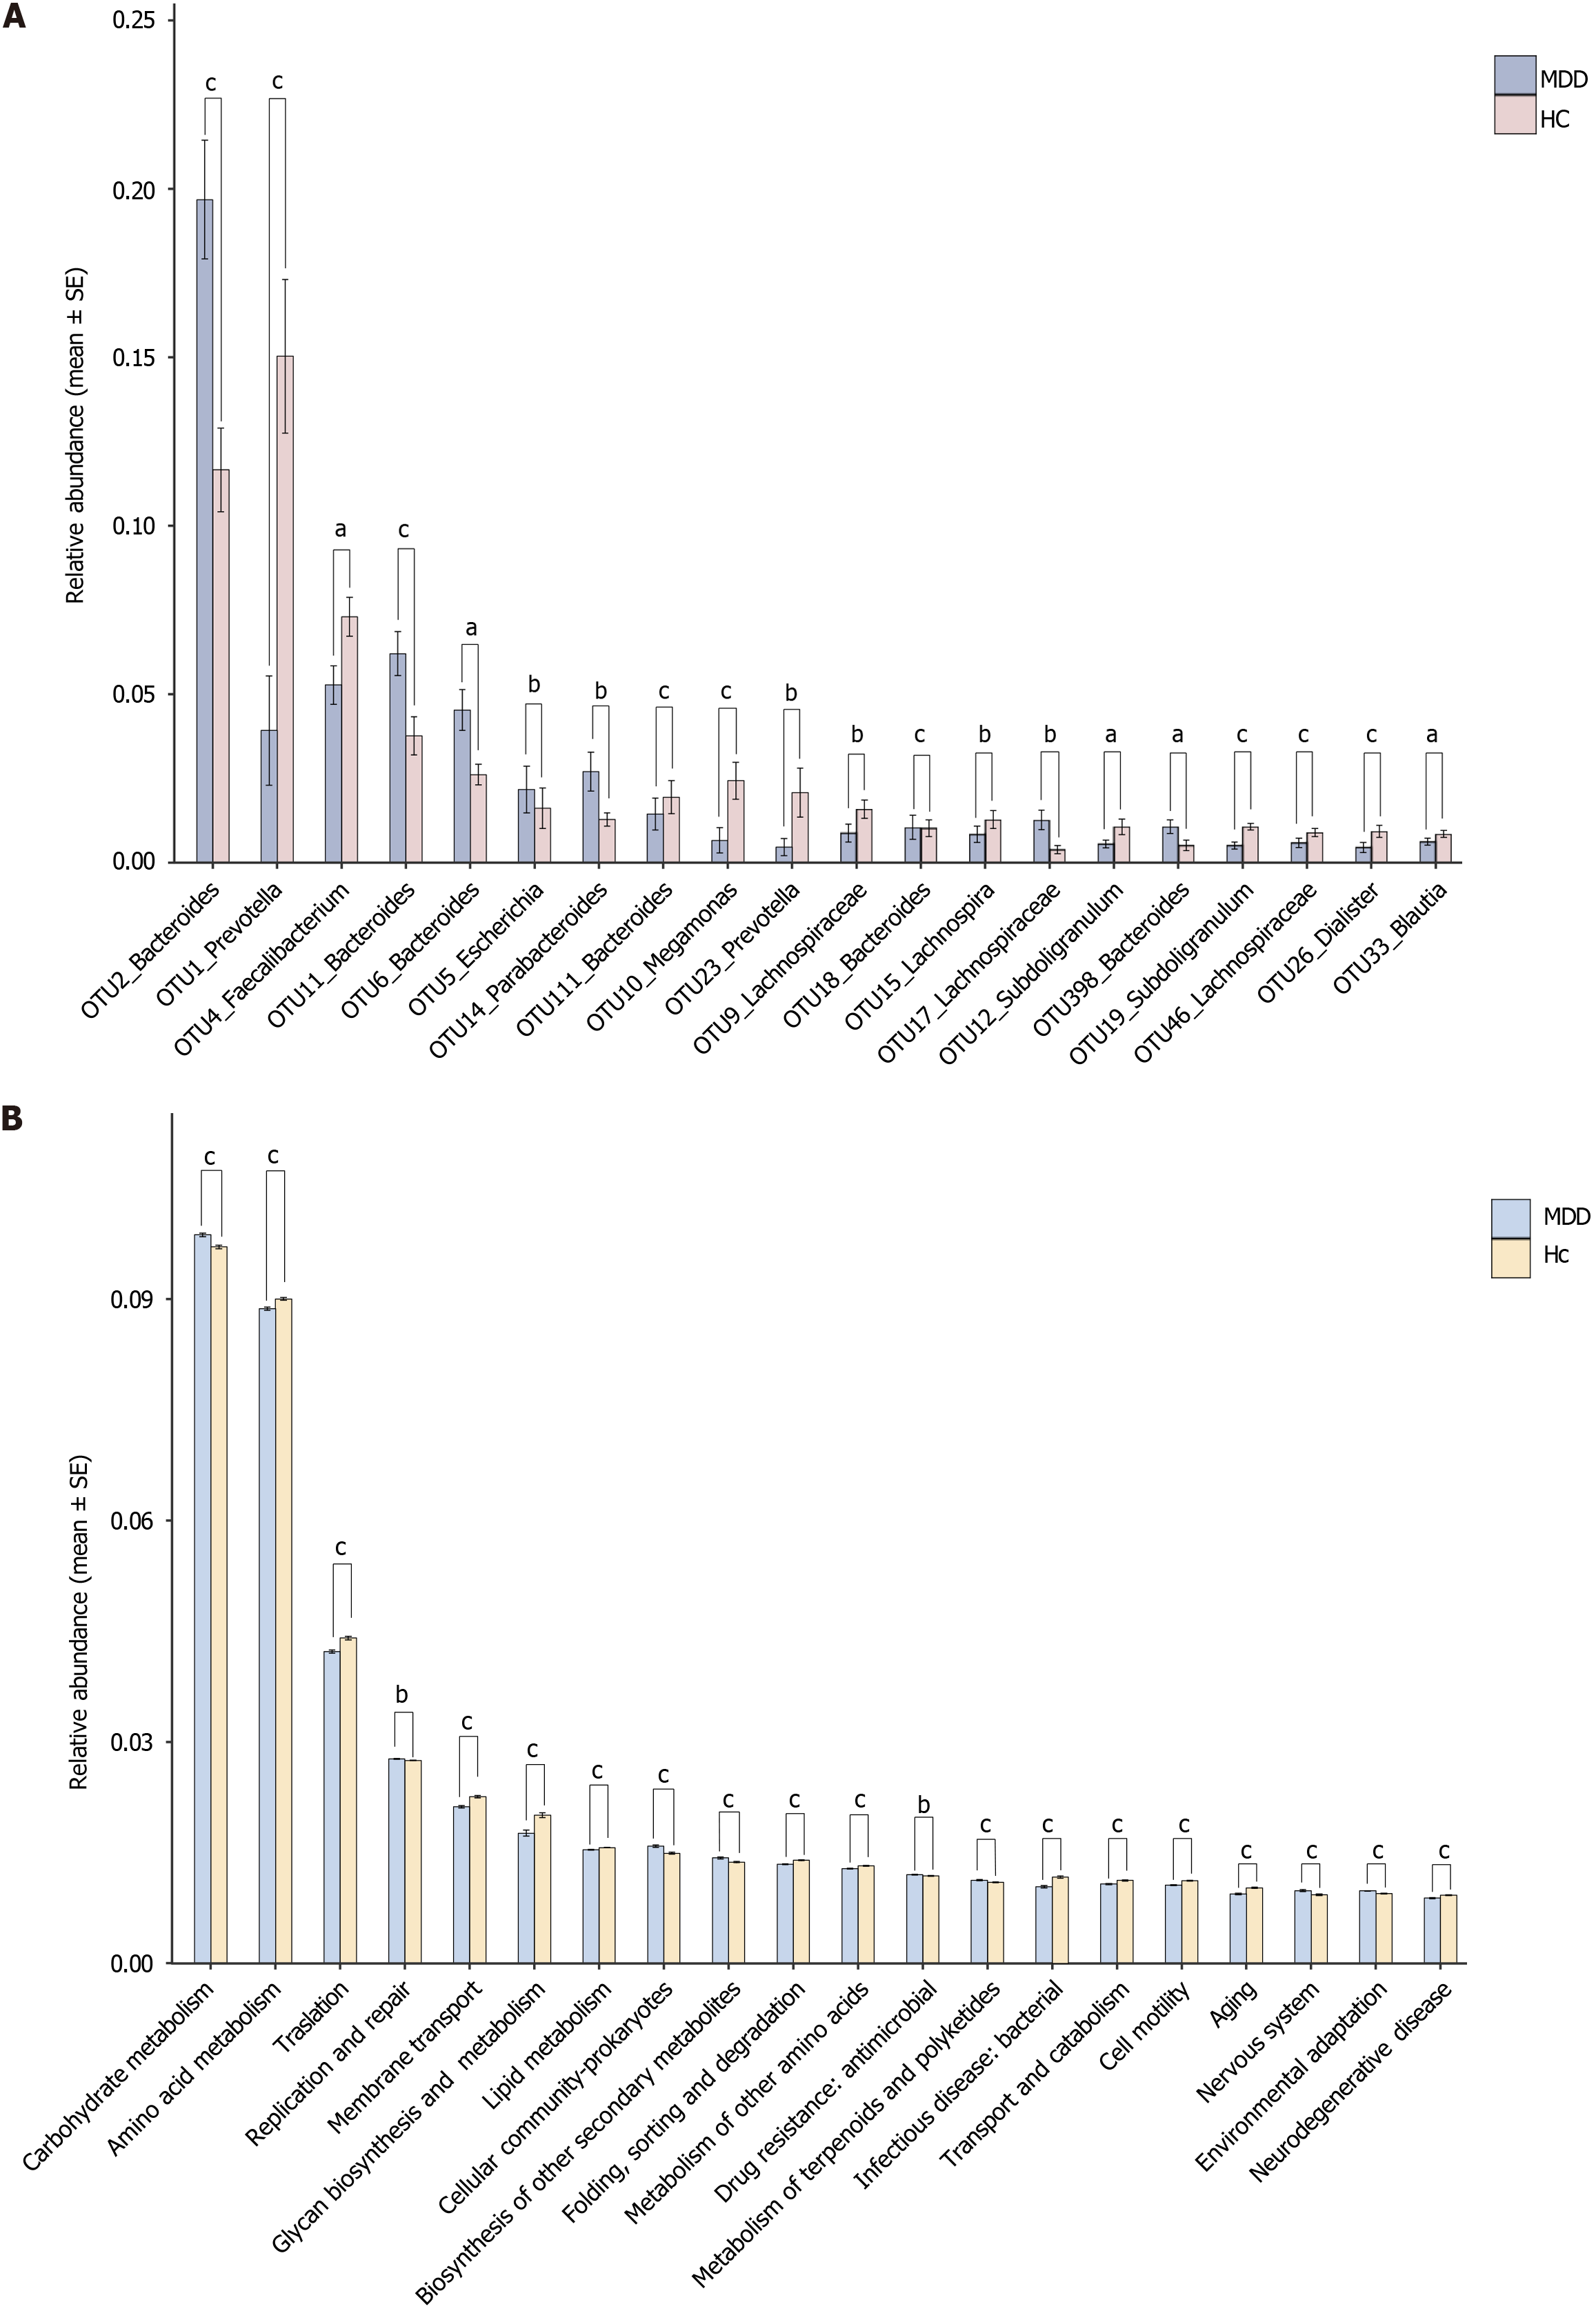
Figure 3 Relative abundance.
A: Comparison of relative abundances between healthy controls and major depressive disorder groups. The top 20 operational taxonomic units with the highest abundance and differences were selected; B: The top 20 functional pathways with the highest abundance and differences. The functional pathways were selected using Phylogenetic Investigation of Communities by Reconstruction of Unobserved States 2. aP < 0.05. bP < 0.01. cP < 0.001. dP < 0.0001. OTU: Operational taxonomic units; MDD: Major depressive disorder; HC: Healthy control.
- Citation: Xu CC, Zhao WX, Sheng Y, Yun YJ, Ma T, Fan N, Song JQ, Wang J, Zhang Q. Serum homocysteine showed potential association with cognition and abnormal gut microbiome in major depressive disorder. World J Psychiatry 2025; 15(3): 102567
- URL: https://www.wjgnet.com/2220-3206/full/v15/i3/102567.htm
- DOI: https://dx.doi.org/10.5498/wjp.v15.i3.102567


