Copyright
©The Author(s) 2025.
World J Psychiatry. Mar 19, 2025; 15(3): 100112
Published online Mar 19, 2025. doi: 10.5498/wjp.v15.i3.100112
Published online Mar 19, 2025. doi: 10.5498/wjp.v15.i3.100112
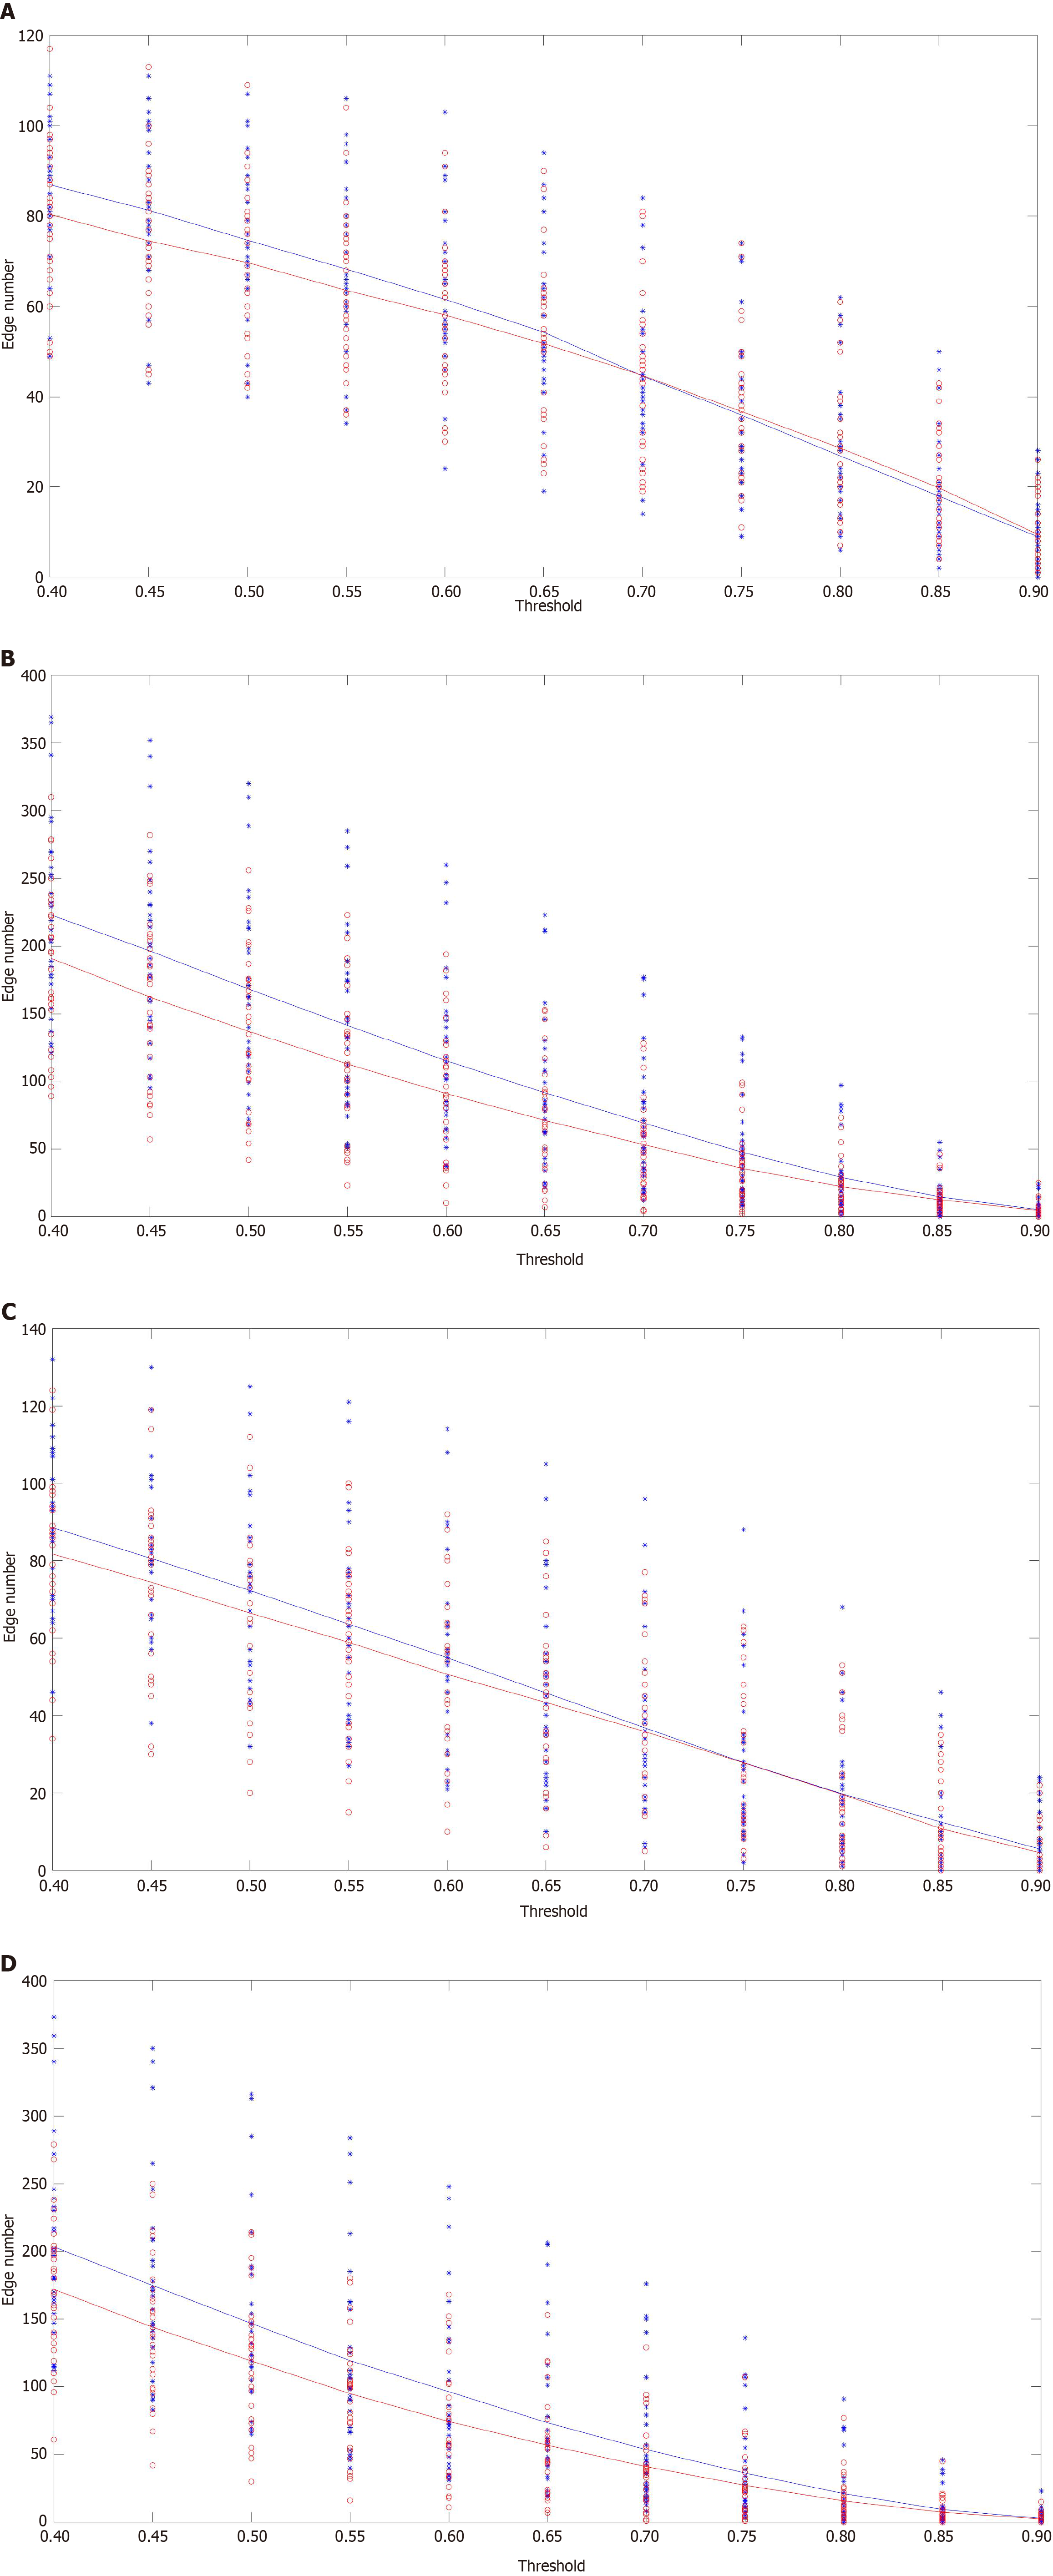
Figure 4 Group comparison of connection edge number.
A-D: The four types (Short-I, Short-II, Long-I, Long-II) of connection edge numbers of each subject in the uninfected group (blue star) and infected group (red circle) at different thresholds (0.4-0.9). The blue and red lines represent the group mean in the uninfected group and infected group at each threshold, respectively.
- Citation: Ma WJ, Yuan RC, Peng ZY, Wu Q, Al-Matary M, Yang HS, Cheng P, Zhao GJ, Lu CC, Zhang YX, Hong JK, Li WH. Mood symptoms, cognitive function, and changes of brain hemodynamics in patients with COVID-19: A functional near-infrared spectroscopy study. World J Psychiatry 2025; 15(3): 100112
- URL: https://www.wjgnet.com/2220-3206/full/v15/i3/100112.htm
- DOI: https://dx.doi.org/10.5498/wjp.v15.i3.100112


