Copyright
©The Author(s) 2025.
World J Psychiatry. Feb 19, 2025; 15(2): 100214
Published online Feb 19, 2025. doi: 10.5498/wjp.v15.i2.100214
Published online Feb 19, 2025. doi: 10.5498/wjp.v15.i2.100214
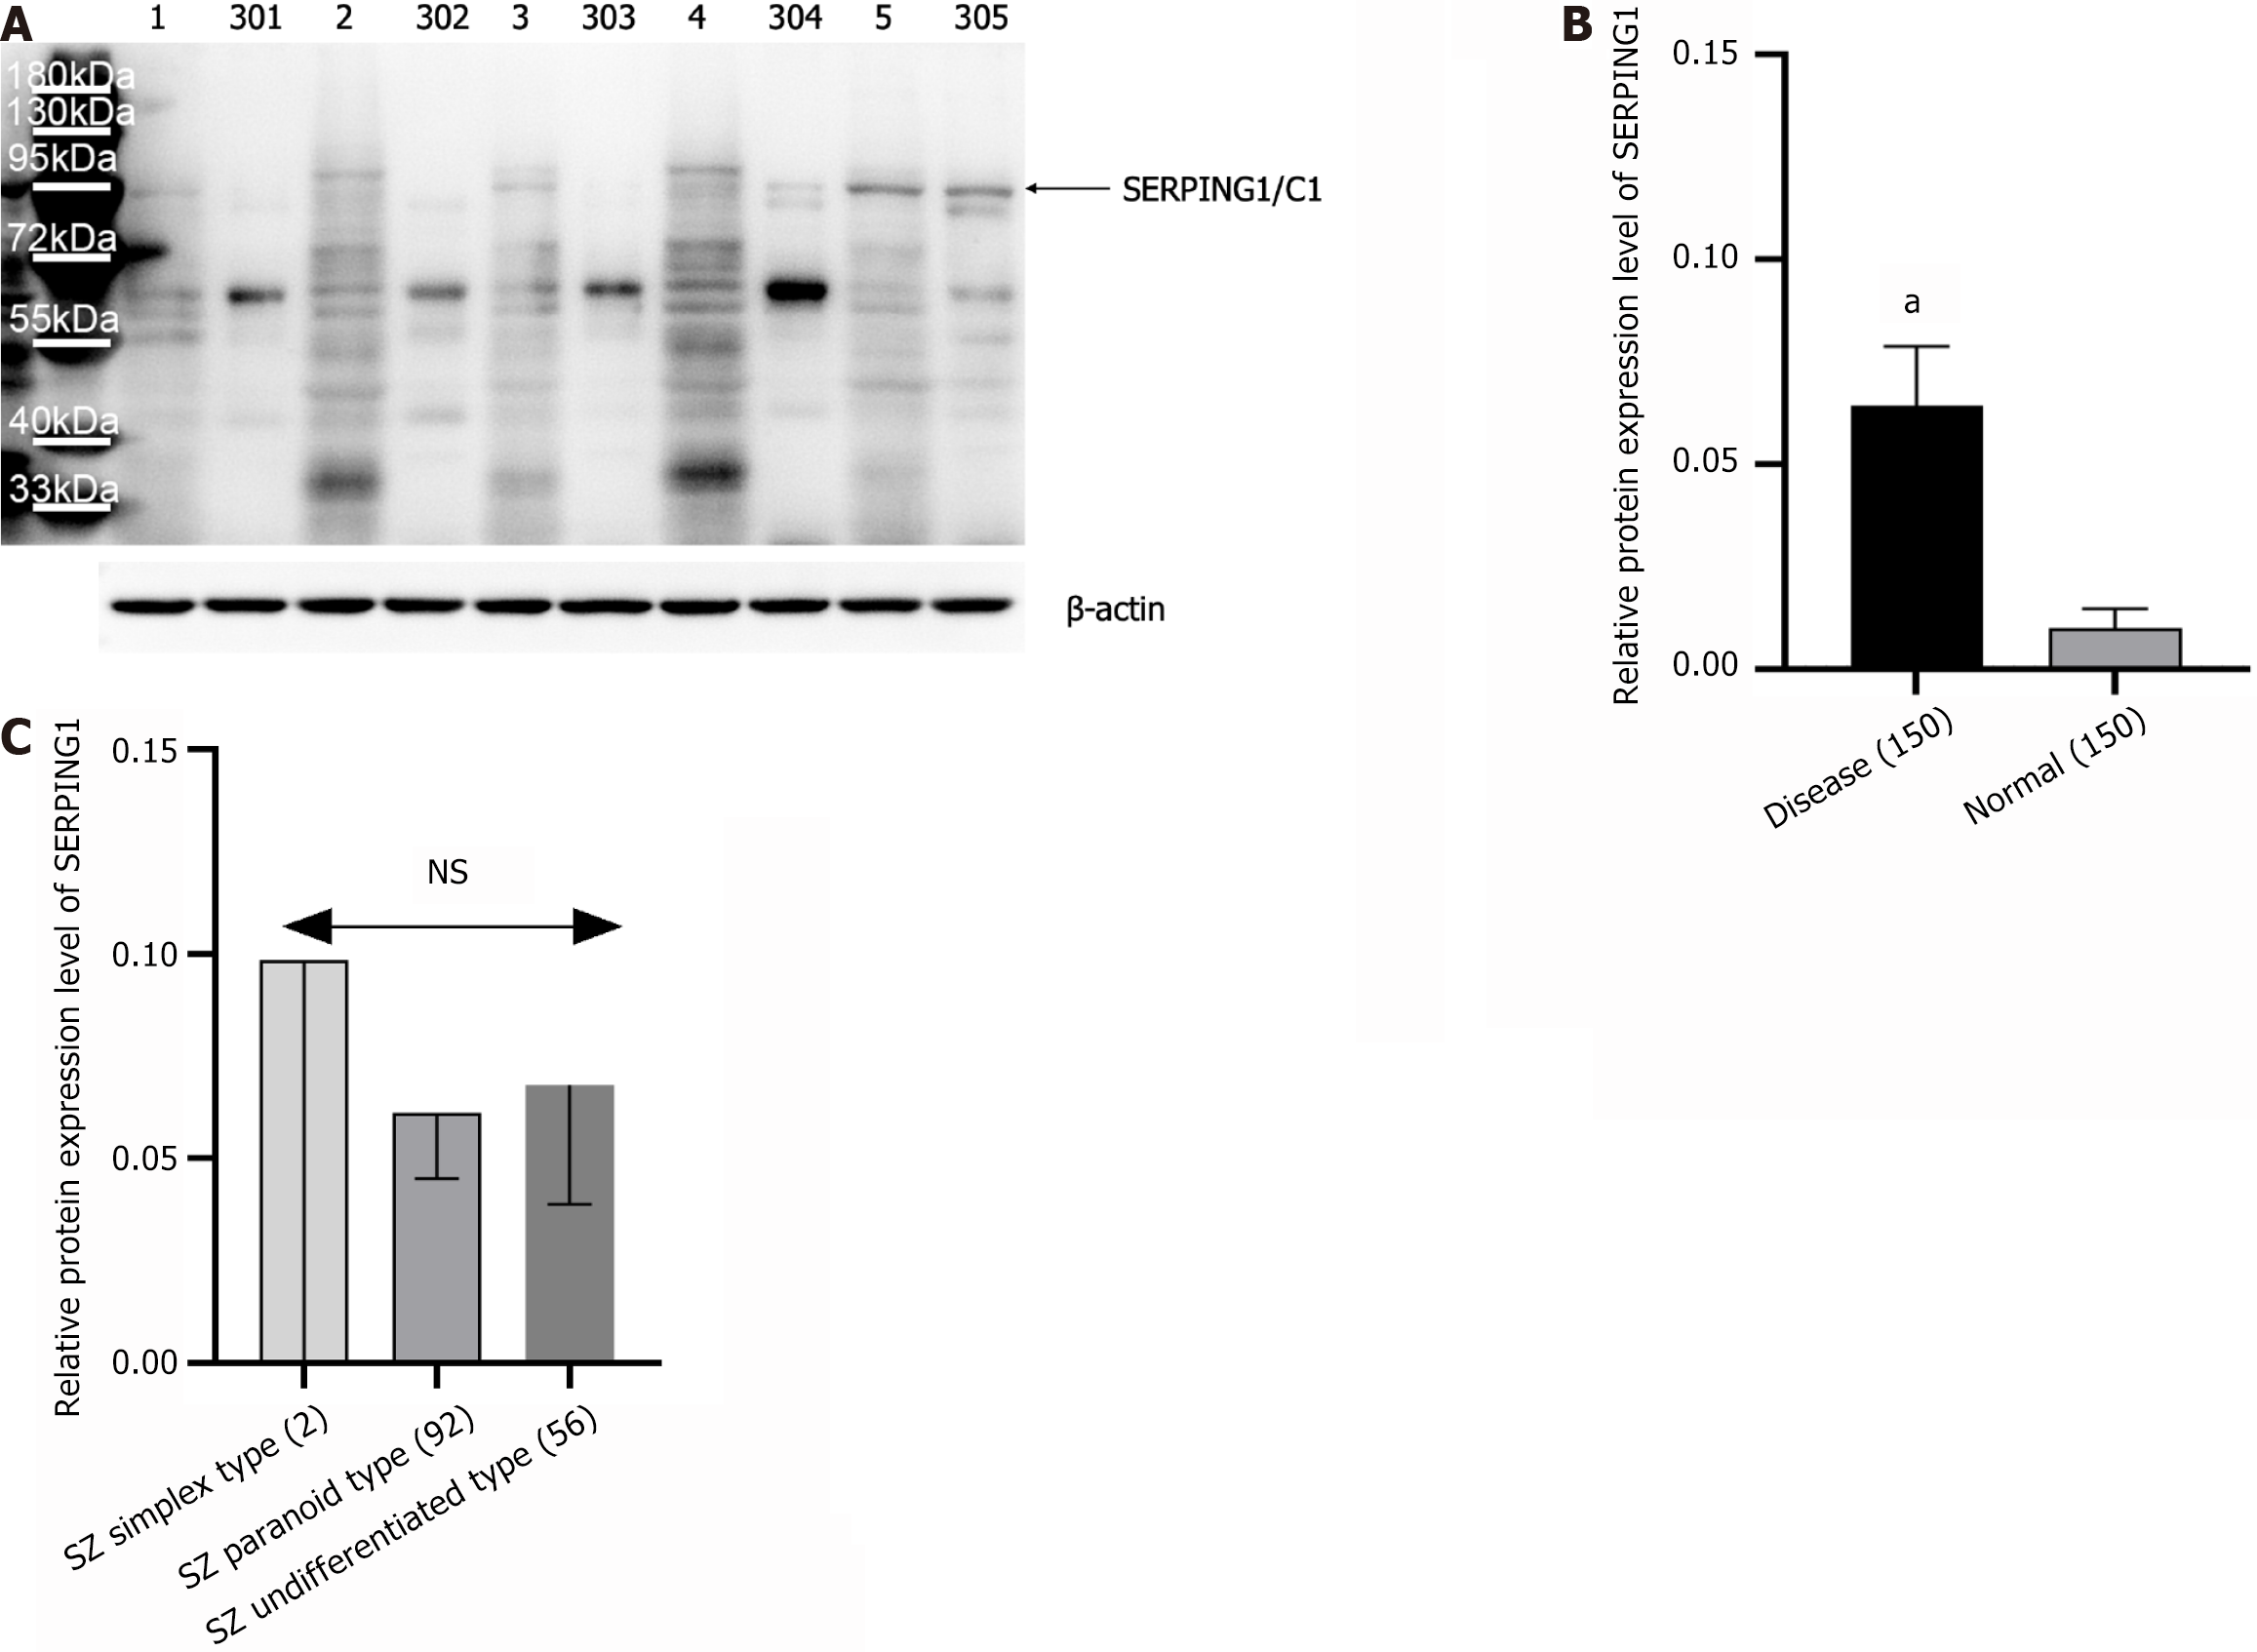
Figure 5 Expression of SERPING1 was detected by western blot (n = 150, including three samples of the results shown in Figure 4A; Here only a subset' western blot images are shown in Figure 5).
A: Immunoblot image [schizophrenia (SZ) group samples numbered 1-150, healthy controls (HC) group samples numbered 301-450; representative western blot images are displayed]; B: Statistical bar chart of relative protein expression comparing SZ and HC groups; C: Statistical bar chart of relative protein expression across SZ subtypes. aP < 0.001, NS: Not significant.
- Citation: Li F, Ren X, Liu JX, Wang TD, Wang B, Wei XB. Integrative transcriptomic and proteomic analysis reveals that SERPING1 inhibits neuronal proliferation via the CaMKII-CREB-BDNF pathway in schizophrenia. World J Psychiatry 2025; 15(2): 100214
- URL: https://www.wjgnet.com/2220-3206/full/v15/i2/100214.htm
- DOI: https://dx.doi.org/10.5498/wjp.v15.i2.100214


