Copyright
©The Author(s) 2025.
World J Psychiatry. Feb 19, 2025; 15(2): 100214
Published online Feb 19, 2025. doi: 10.5498/wjp.v15.i2.100214
Published online Feb 19, 2025. doi: 10.5498/wjp.v15.i2.100214
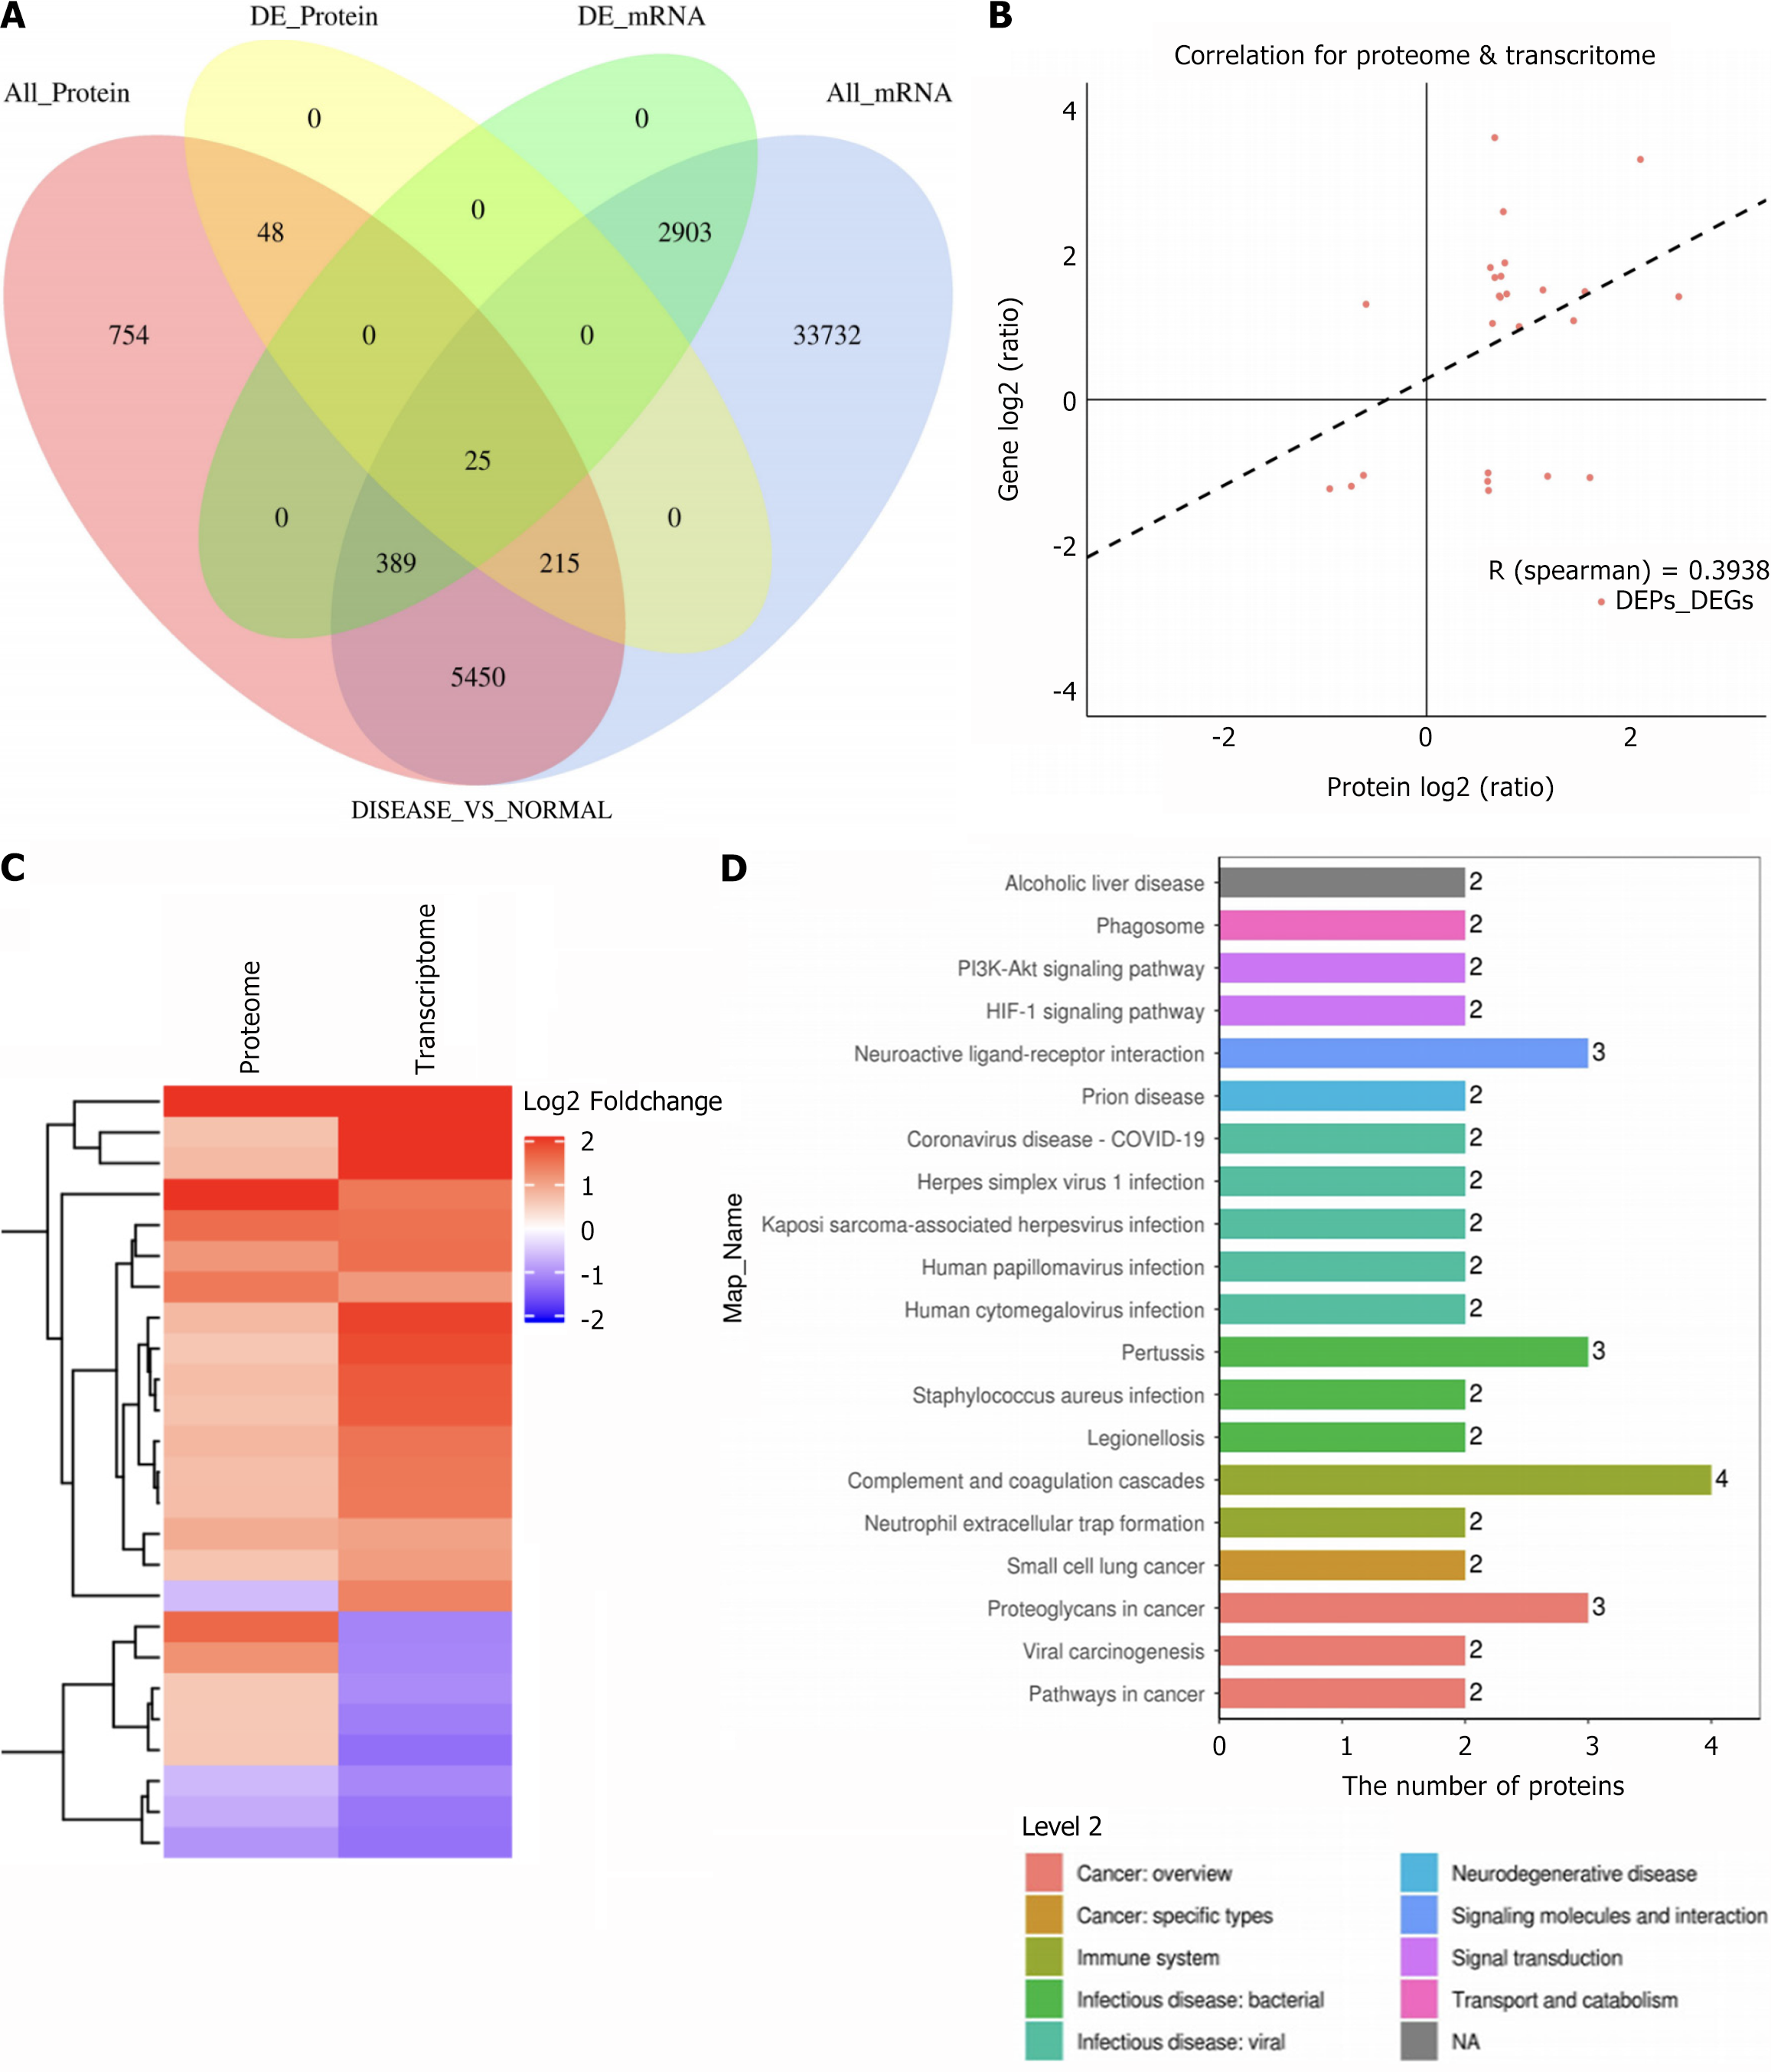
Figure 3 Integrated transcriptomics and proteomics analysis.
A: Venn diagram showing overlapping transcriptomic and proteomic associations at the quantitative and differential expression levels (DE_Protein numbers represent genes corresponding to proteins); B: Correlation analysis (Spearman) between significantly differentially expressed genes and proteins; C: Cluster heatmap of transcriptomic and proteomic expression patterns for associated molecules; D: KEGG enrichment analysis of differentially expressed genes.
- Citation: Li F, Ren X, Liu JX, Wang TD, Wang B, Wei XB. Integrative transcriptomic and proteomic analysis reveals that SERPING1 inhibits neuronal proliferation via the CaMKII-CREB-BDNF pathway in schizophrenia. World J Psychiatry 2025; 15(2): 100214
- URL: https://www.wjgnet.com/2220-3206/full/v15/i2/100214.htm
- DOI: https://dx.doi.org/10.5498/wjp.v15.i2.100214


