Copyright
©The Author(s) 2025.
World J Psychiatry. Feb 19, 2025; 15(2): 100214
Published online Feb 19, 2025. doi: 10.5498/wjp.v15.i2.100214
Published online Feb 19, 2025. doi: 10.5498/wjp.v15.i2.100214
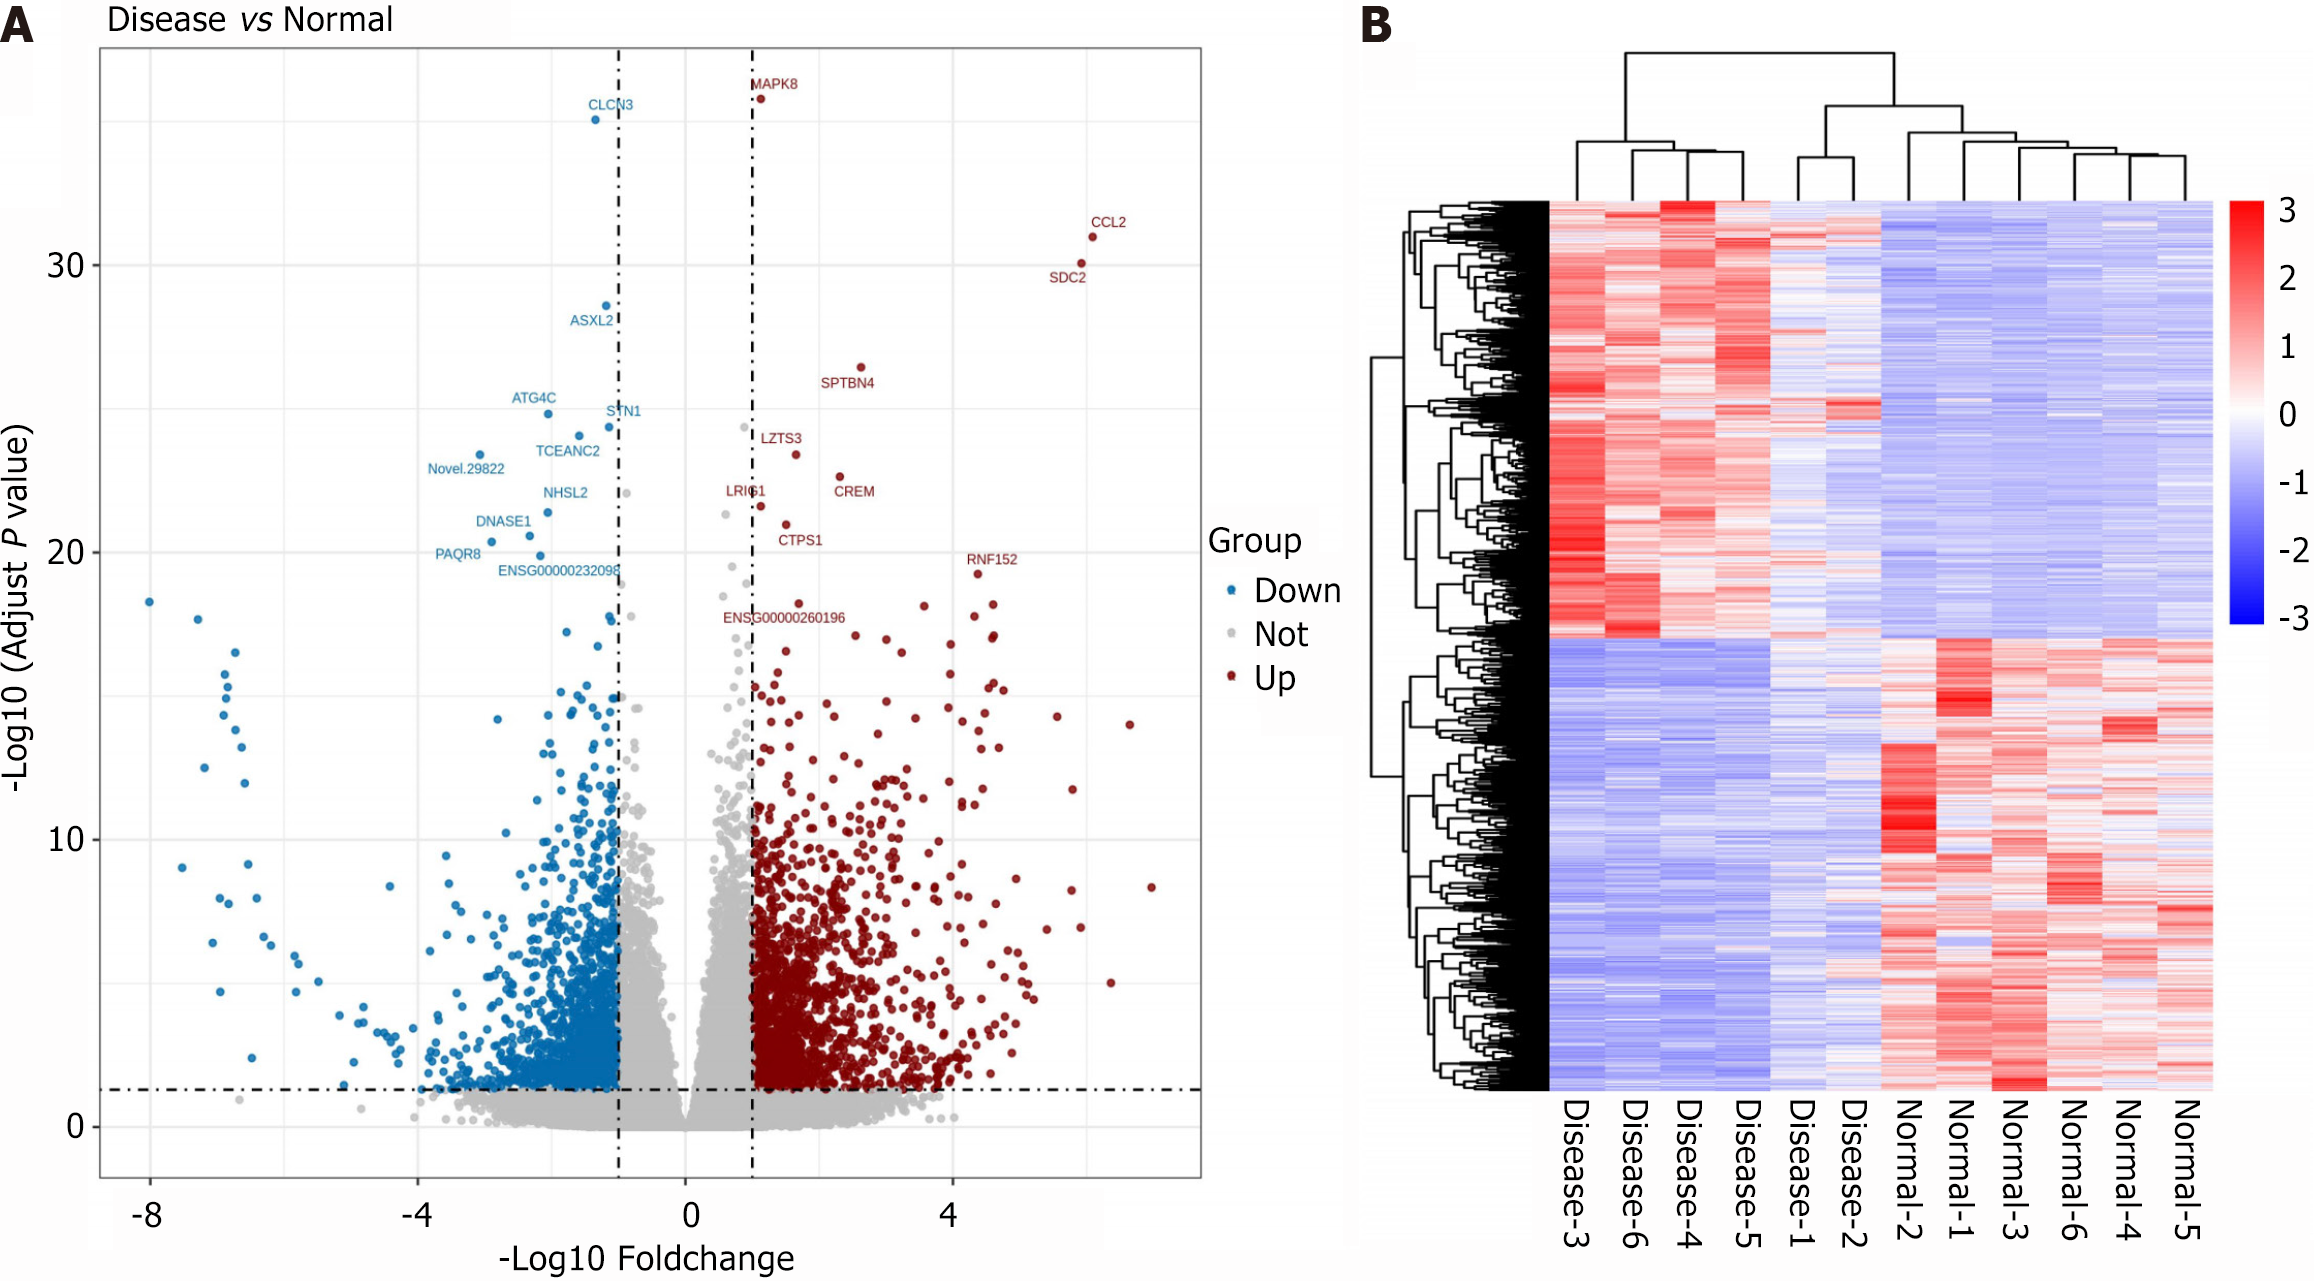
Figure 1 Analysis of transcriptomics sequencing results.
A: Volcano plot illustrating the distribution of differentially expressed genes between the schizophrenia (SZ) and Healthy controls (HC) groups; B: Cluster heatmap of differentially expressed genes in the SZ and HC groups.
- Citation: Li F, Ren X, Liu JX, Wang TD, Wang B, Wei XB. Integrative transcriptomic and proteomic analysis reveals that SERPING1 inhibits neuronal proliferation via the CaMKII-CREB-BDNF pathway in schizophrenia. World J Psychiatry 2025; 15(2): 100214
- URL: https://www.wjgnet.com/2220-3206/full/v15/i2/100214.htm
- DOI: https://dx.doi.org/10.5498/wjp.v15.i2.100214


