Copyright
©The Author(s) 2025.
World J Psychiatry. Jan 19, 2025; 15(1): 97945
Published online Jan 19, 2025. doi: 10.5498/wjp.v15.i1.97945
Published online Jan 19, 2025. doi: 10.5498/wjp.v15.i1.97945
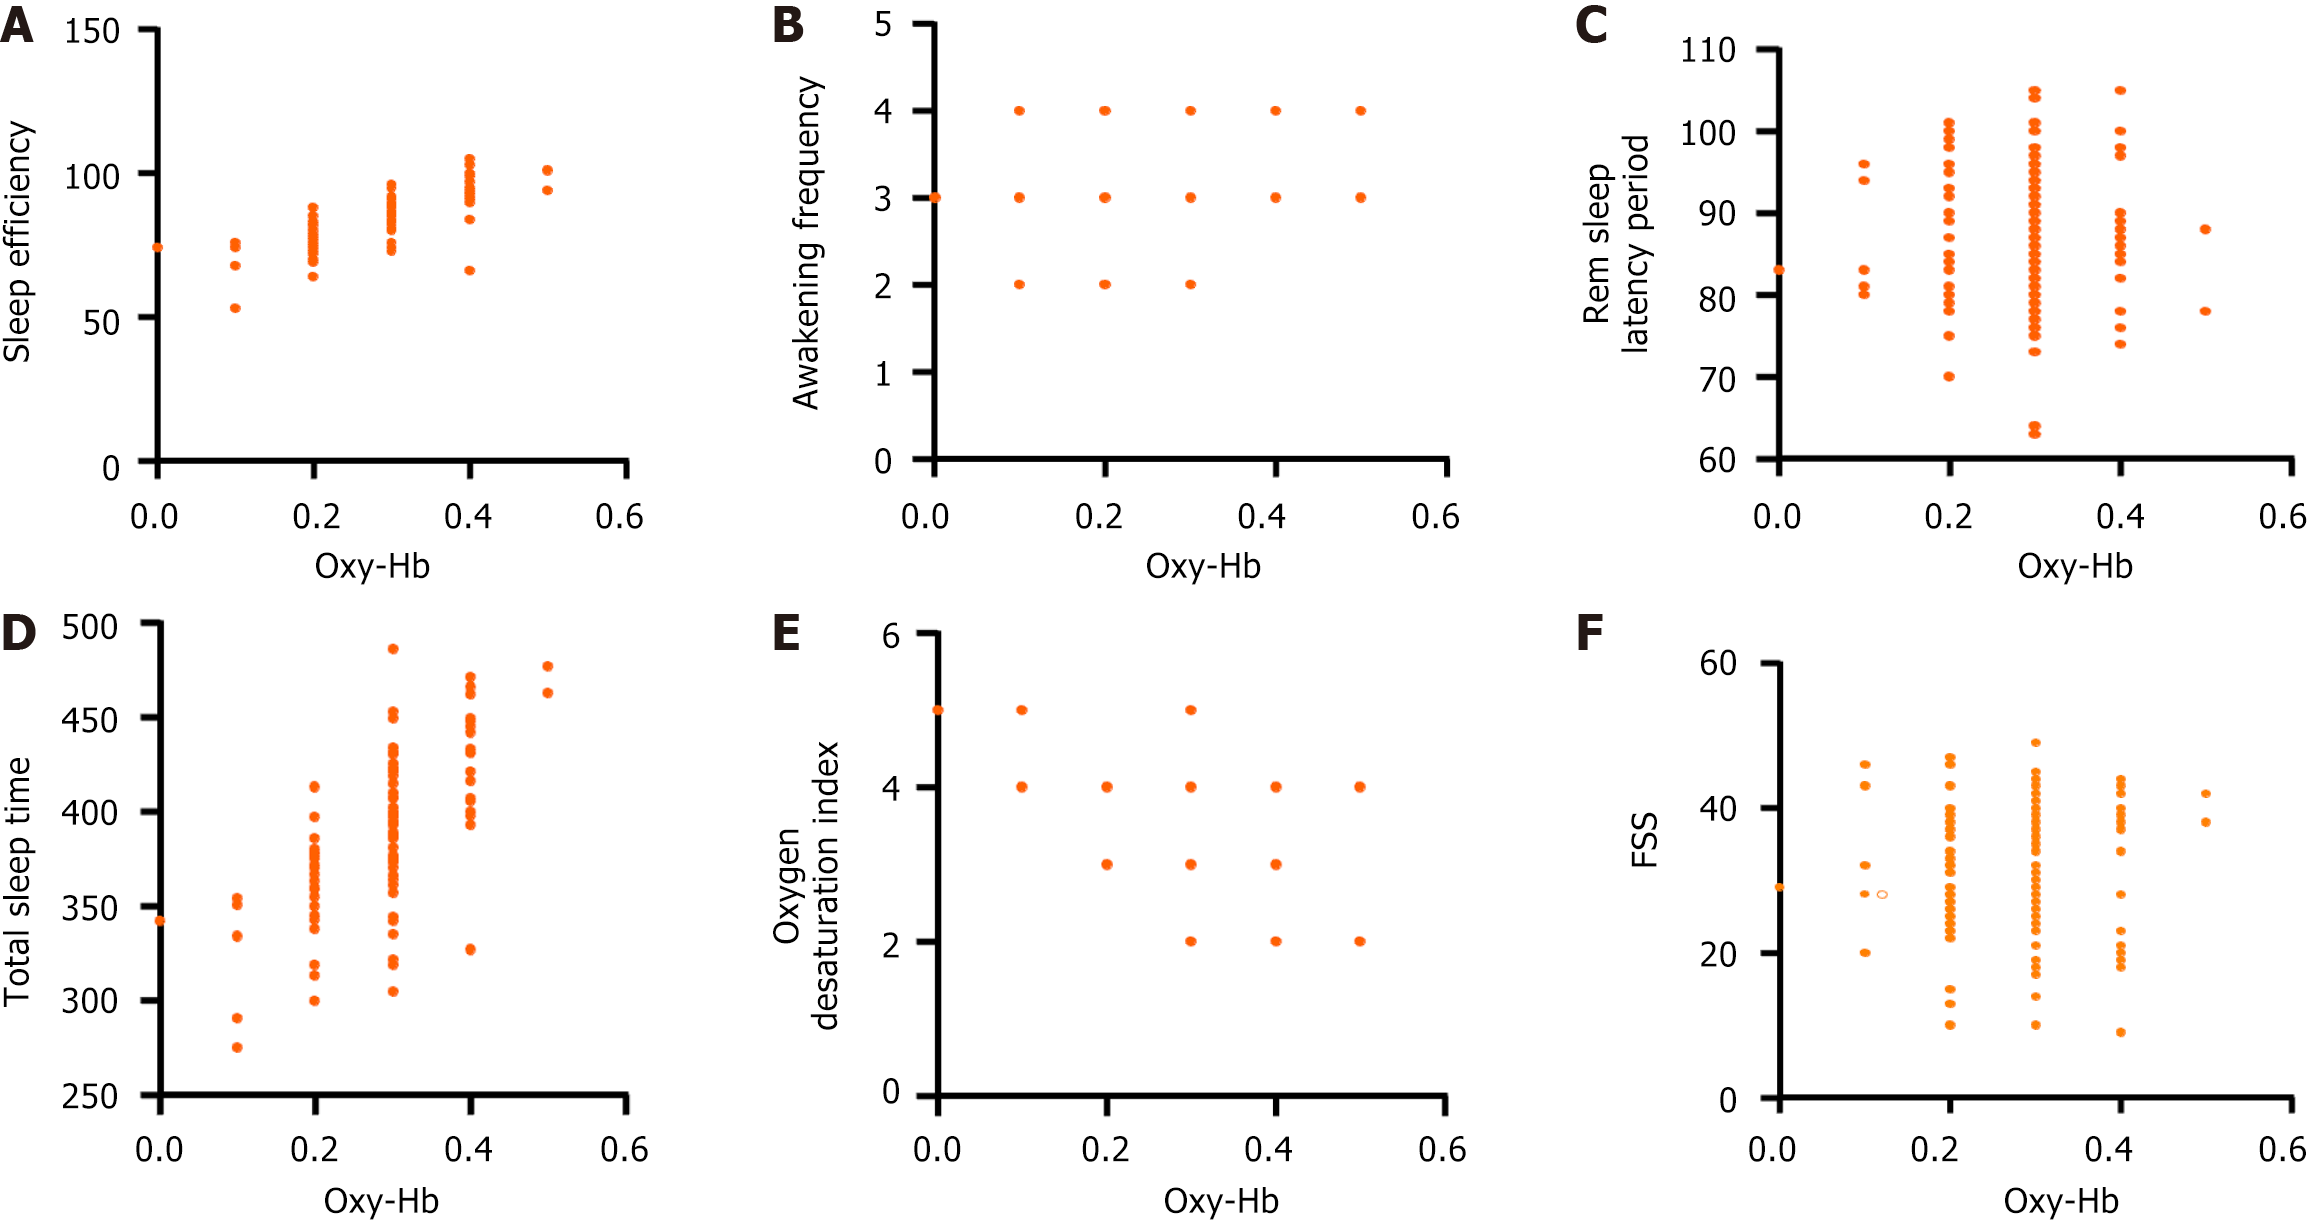
Figure 6 Scatterplot of the correlation between oxyhemoglobin concentration during the task period and sleep parameters and fatigue severity scale scores.
A: Sleep efficiency; B: Awakening frequency; C: Rem sleep latency period; D: Total sleep time; E: Oxygen desaturation index; F: Fatigue severity scale score. FSS: Fatigue severity scale; Oxy-Hb: Oxyhemoglobin.
- Citation: Liao H, Liao S, Gao YJ, Wang X, Guo LH, Zheng S, Yang W, Dai YN. Near-infrared brain functional characteristics of mild cognitive impairment with sleep disorders. World J Psychiatry 2025; 15(1): 97945
- URL: https://www.wjgnet.com/2220-3206/full/v15/i1/97945.htm
- DOI: https://dx.doi.org/10.5498/wjp.v15.i1.97945


