Copyright
©The Author(s) 2024.
World J Psychiatry. Sep 19, 2024; 14(9): 1386-1396
Published online Sep 19, 2024. doi: 10.5498/wjp.v14.i9.1386
Published online Sep 19, 2024. doi: 10.5498/wjp.v14.i9.1386
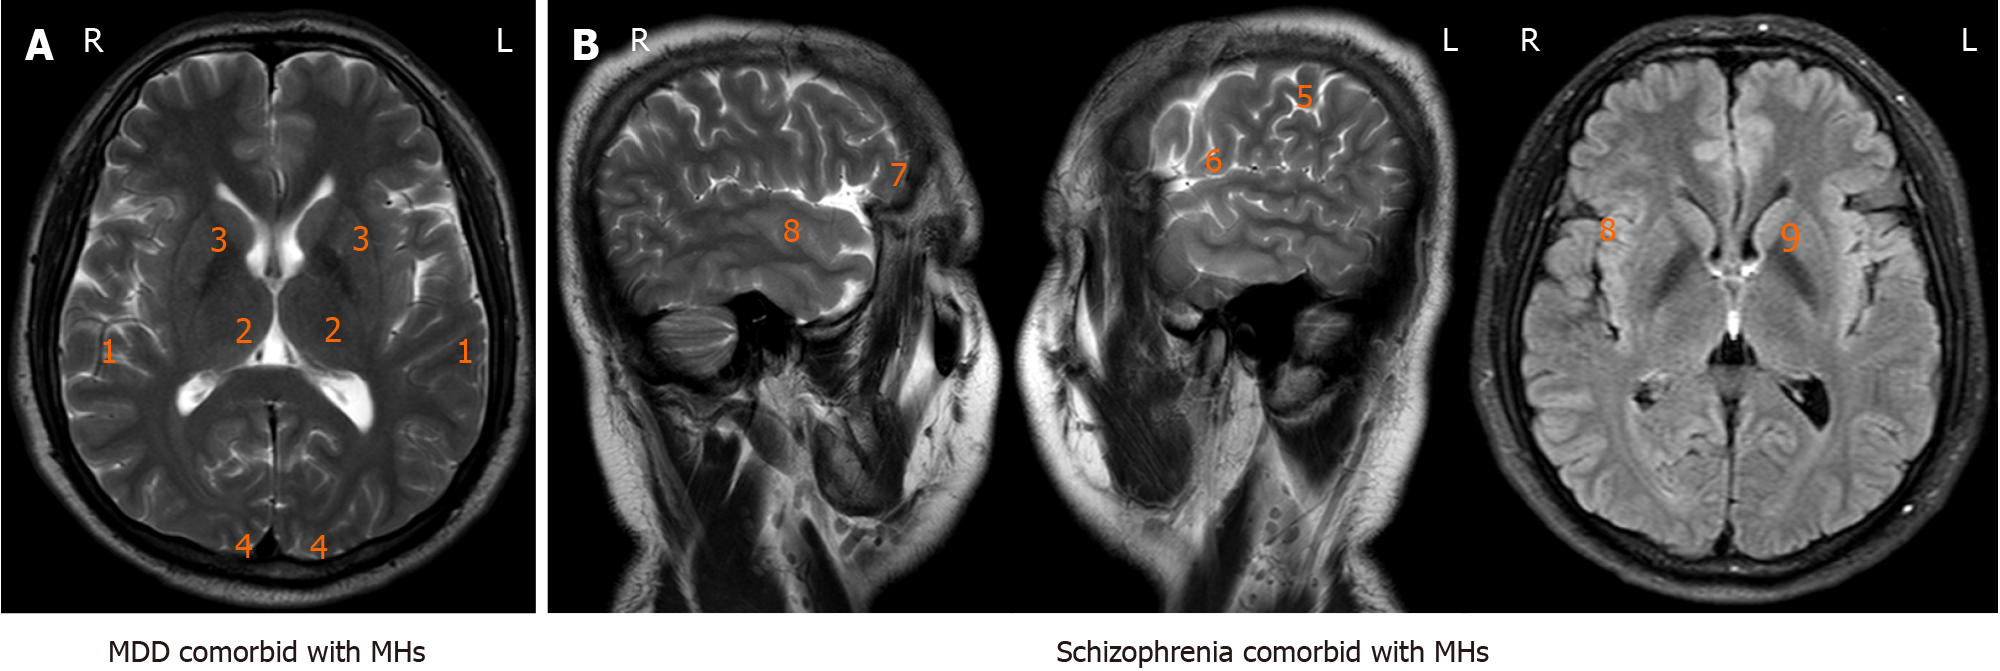
Figure 3 Schematic display of neurological regions increased activation in association with musical hallucinations and psychiatry diseases.
Standardized magnetic resonance imaging (MRI) on contrast enhanced T1-weighted axial image the brain viewed from the side, sagittal (left and right); back, coronal (middle); and above axial (right). Specific cortical regions and subcortical structures are labeled. The MRI image was offered by the Department of Radiology and Biomedical Imaging, Shanxi Bethune Hospital, Shanxi Academy of Medical Sciences. A: Represents the active brain area in the individuals of major depressive disorder comorbid with musical hallucinations (MH); B: Represents the active brain area in the individuals of schizophrenia comorbid with MH. 1Superior temporal cortex; 2Thalamus; 3Basal ganglia; 4Parasagittal occipital cortex; 5Inferior and middle frontal gyri; 6Left dorsolateral, prefrontal cortex; 7Right orbitofrontal cortex, and right middle temporal gyrus; 8Right auditory associated cortex and striatal regions; 9Left caudate head. MDD: Major depressive disorder; MHs: Musical hallucinations; L: Left; R: Right.
- Citation: Lian X, Song W, Si TM, Lian NZ. Classification of musical hallucinations and the characters along with neural-molecular mechanisms of musical hallucinations associated with psychiatric disorders. World J Psychiatry 2024; 14(9): 1386-1396
- URL: https://www.wjgnet.com/2220-3206/full/v14/i9/1386.htm
- DOI: https://dx.doi.org/10.5498/wjp.v14.i9.1386


