Copyright
©The Author(s) 2024.
World J Psychiatry. Sep 19, 2024; 14(9): 1308-1318
Published online Sep 19, 2024. doi: 10.5498/wjp.v14.i9.1308
Published online Sep 19, 2024. doi: 10.5498/wjp.v14.i9.1308
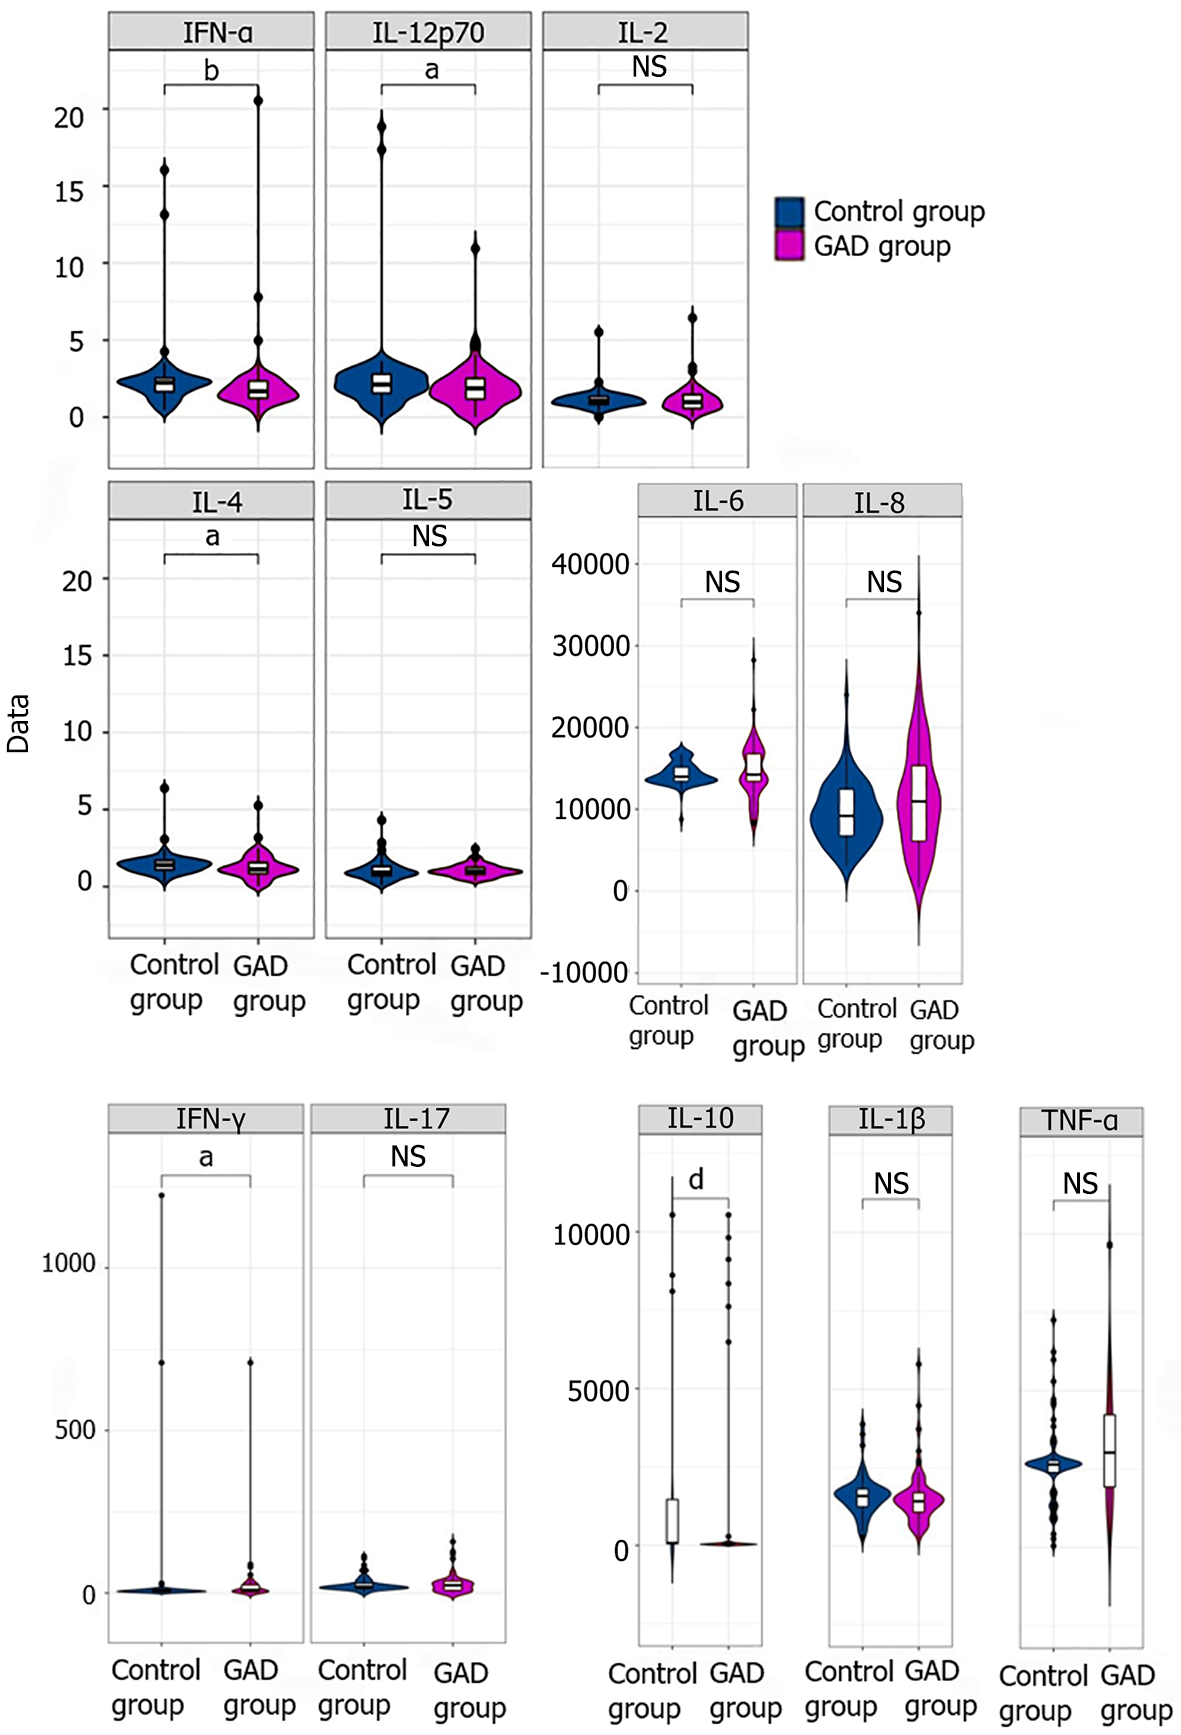
Figure 2 Violin plot comparing levels of inflammation-related cytokines between groups after lipopolysaccharide stimulation.
aP < 0.05; bP < 0.01; dP < 0.0001. GAD: Generalized anxiety disorder; NS: Not significant; IFN: Interferon; IL: Interleukin; TNF: Tumor necrosis factor.
- Citation: Wang WY, Liu N, Qi XX, Han B, Sun JN, Chen ZL, Wang MW, Wang YY. Predictive effect of lipopolysaccharide-stimulated inflammatory cytokines on symptoms of generalized anxiety disorder. World J Psychiatry 2024; 14(9): 1308-1318
- URL: https://www.wjgnet.com/2220-3206/full/v14/i9/1308.htm
- DOI: https://dx.doi.org/10.5498/wjp.v14.i9.1308


