Copyright
©The Author(s) 2024.
World J Psychiatry. Aug 19, 2024; 14(8): 1267-1284
Published online Aug 19, 2024. doi: 10.5498/wjp.v14.i8.1267
Published online Aug 19, 2024. doi: 10.5498/wjp.v14.i8.1267
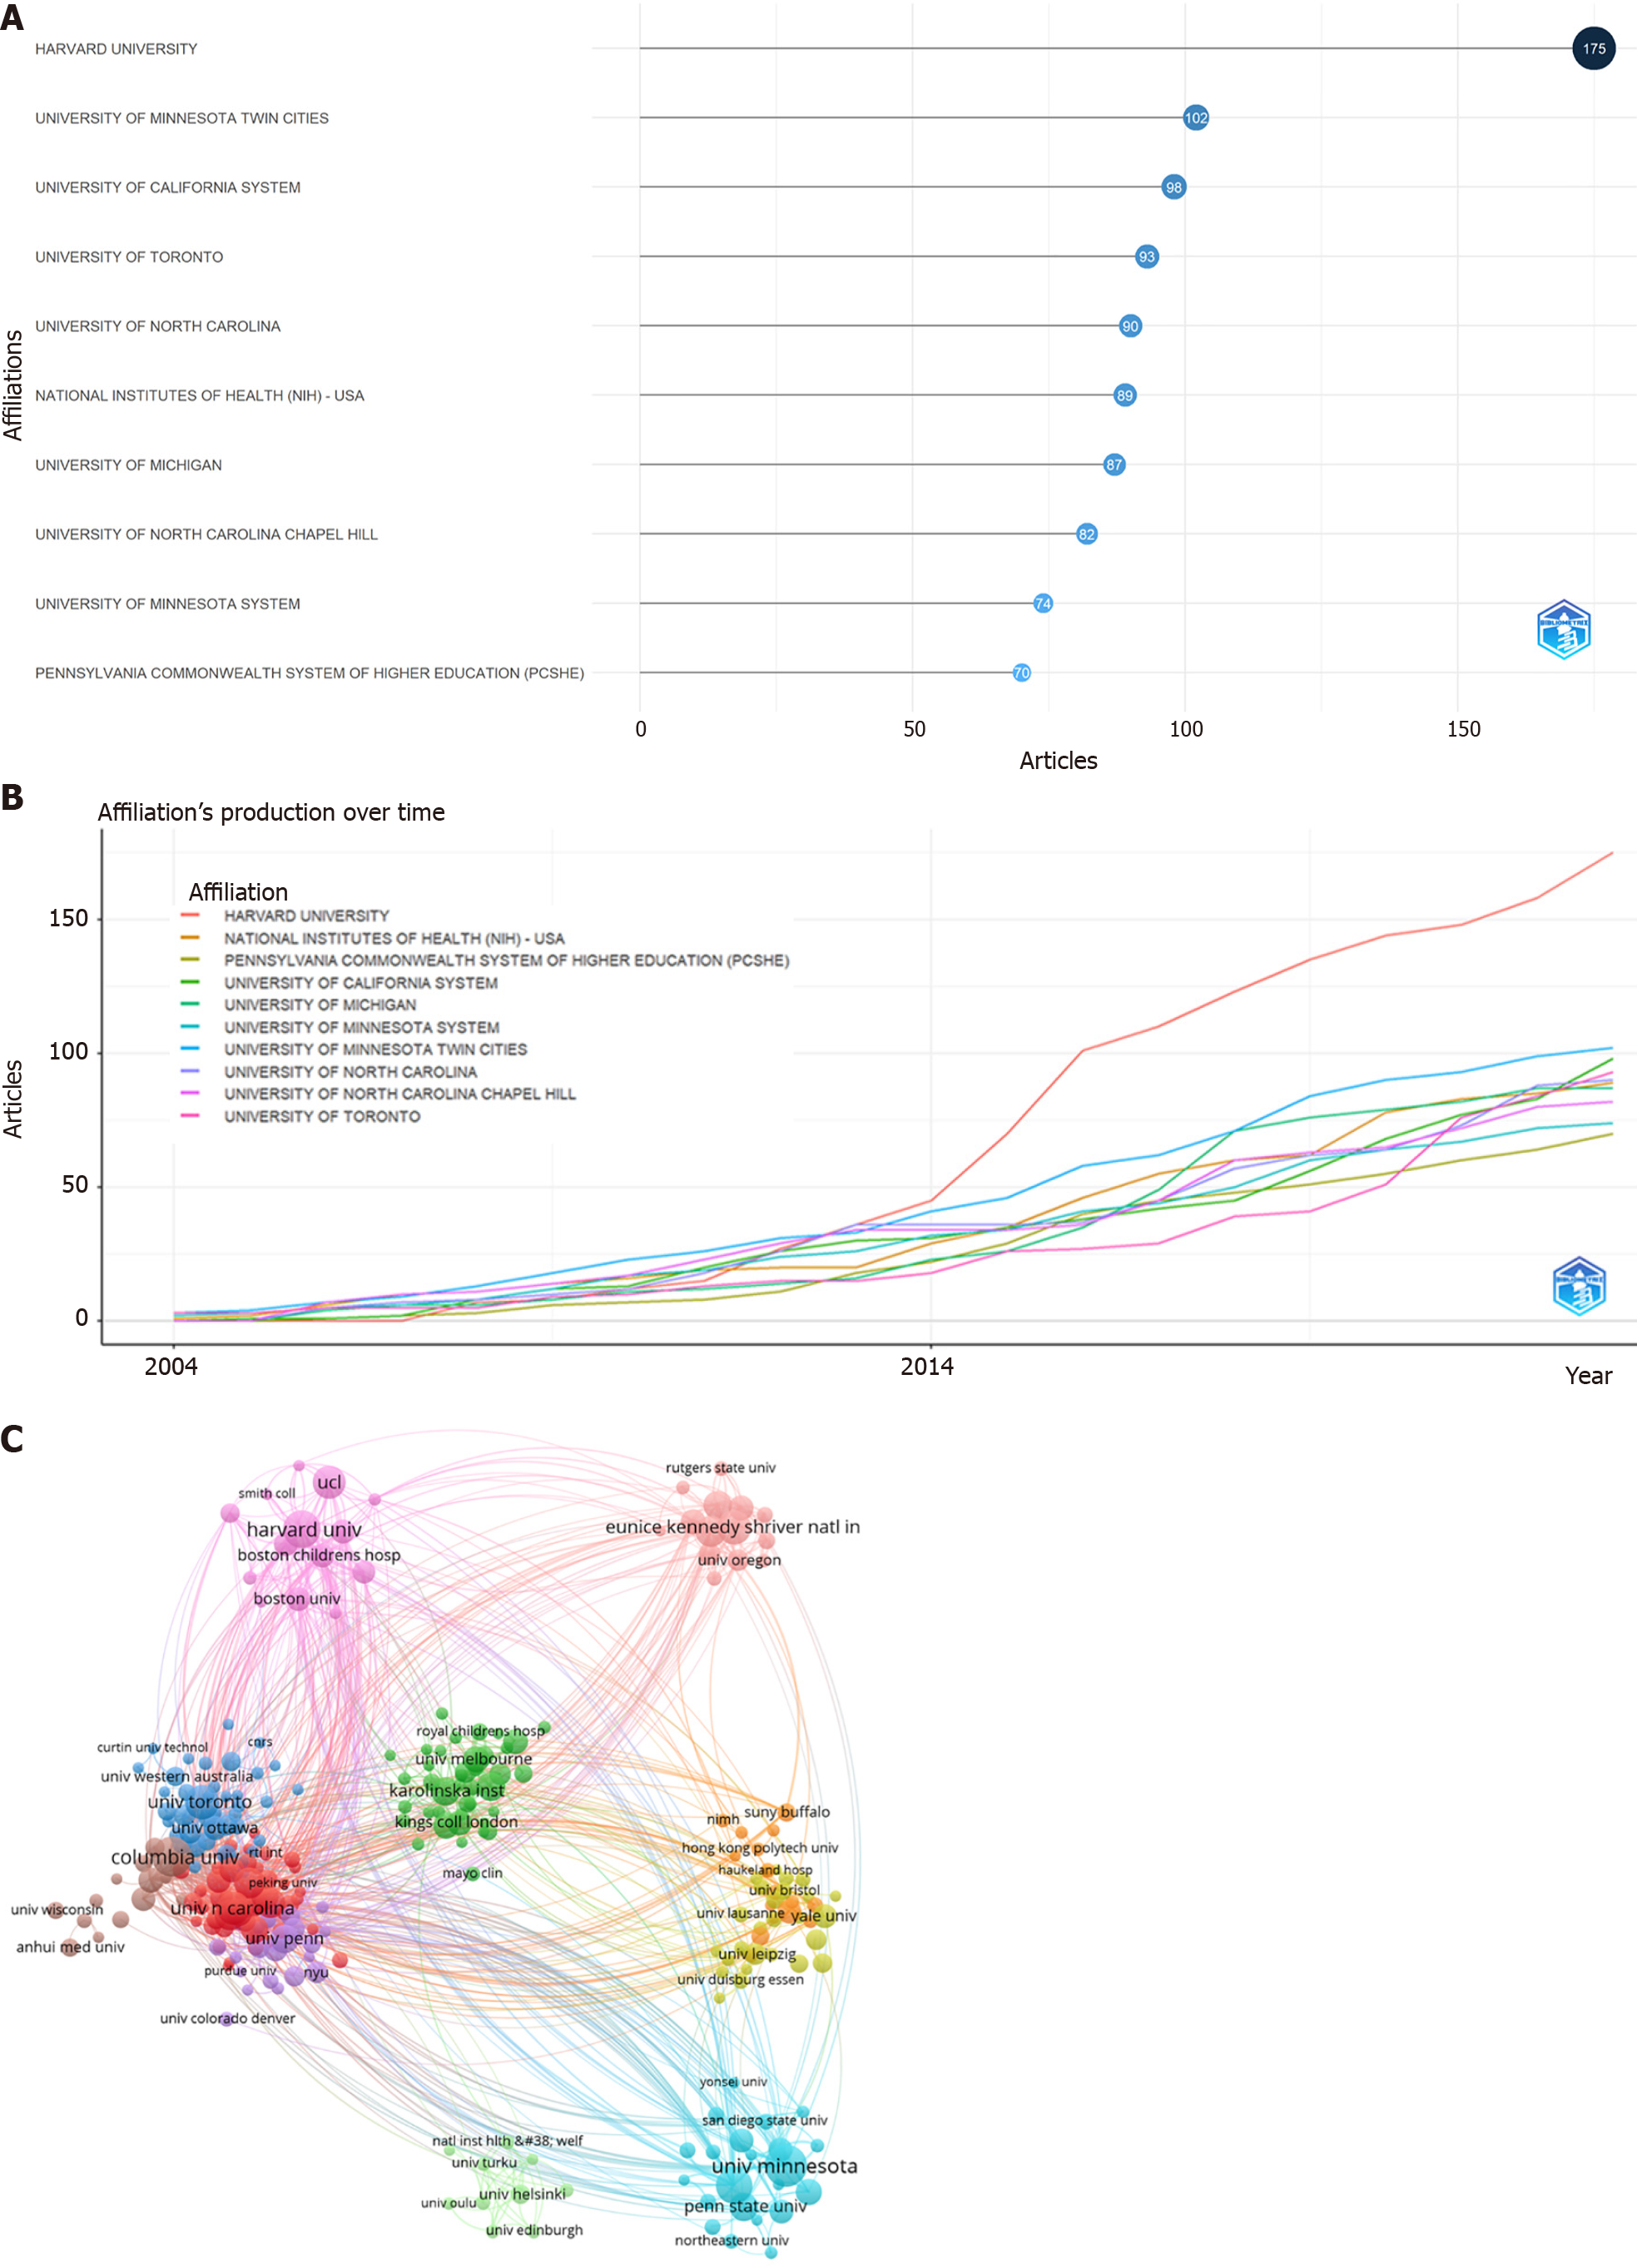
Figure 3 Affiliation analysis from 2004 to 2023.
A: The top 10 relevant affiliations; B: Over time, the top 10 most relevant affiliations, with circle sizes reflecting the number of publications and color gradients indicating the number of citations per year; C: Co-occurrence network of institutions. The size of each node corresponds to the number of publications, and different colors represent different clusters. The thickness of the lines indicates the degree of cooperation.
- Citation: Wang YQ, Wu TT, Li Y, Cui SE, Li YS. Global research trends and hotspots in overweight/obese comorbid with depression among children and adolescents: A bibliometric analysis. World J Psychiatry 2024; 14(8): 1267-1284
- URL: https://www.wjgnet.com/2220-3206/full/v14/i8/1267.htm
- DOI: https://dx.doi.org/10.5498/wjp.v14.i8.1267


