Copyright
©The Author(s) 2024.
World J Psychiatry. Dec 19, 2024; 14(12): 1936-1946
Published online Dec 19, 2024. doi: 10.5498/wjp.v14.i12.1936
Published online Dec 19, 2024. doi: 10.5498/wjp.v14.i12.1936
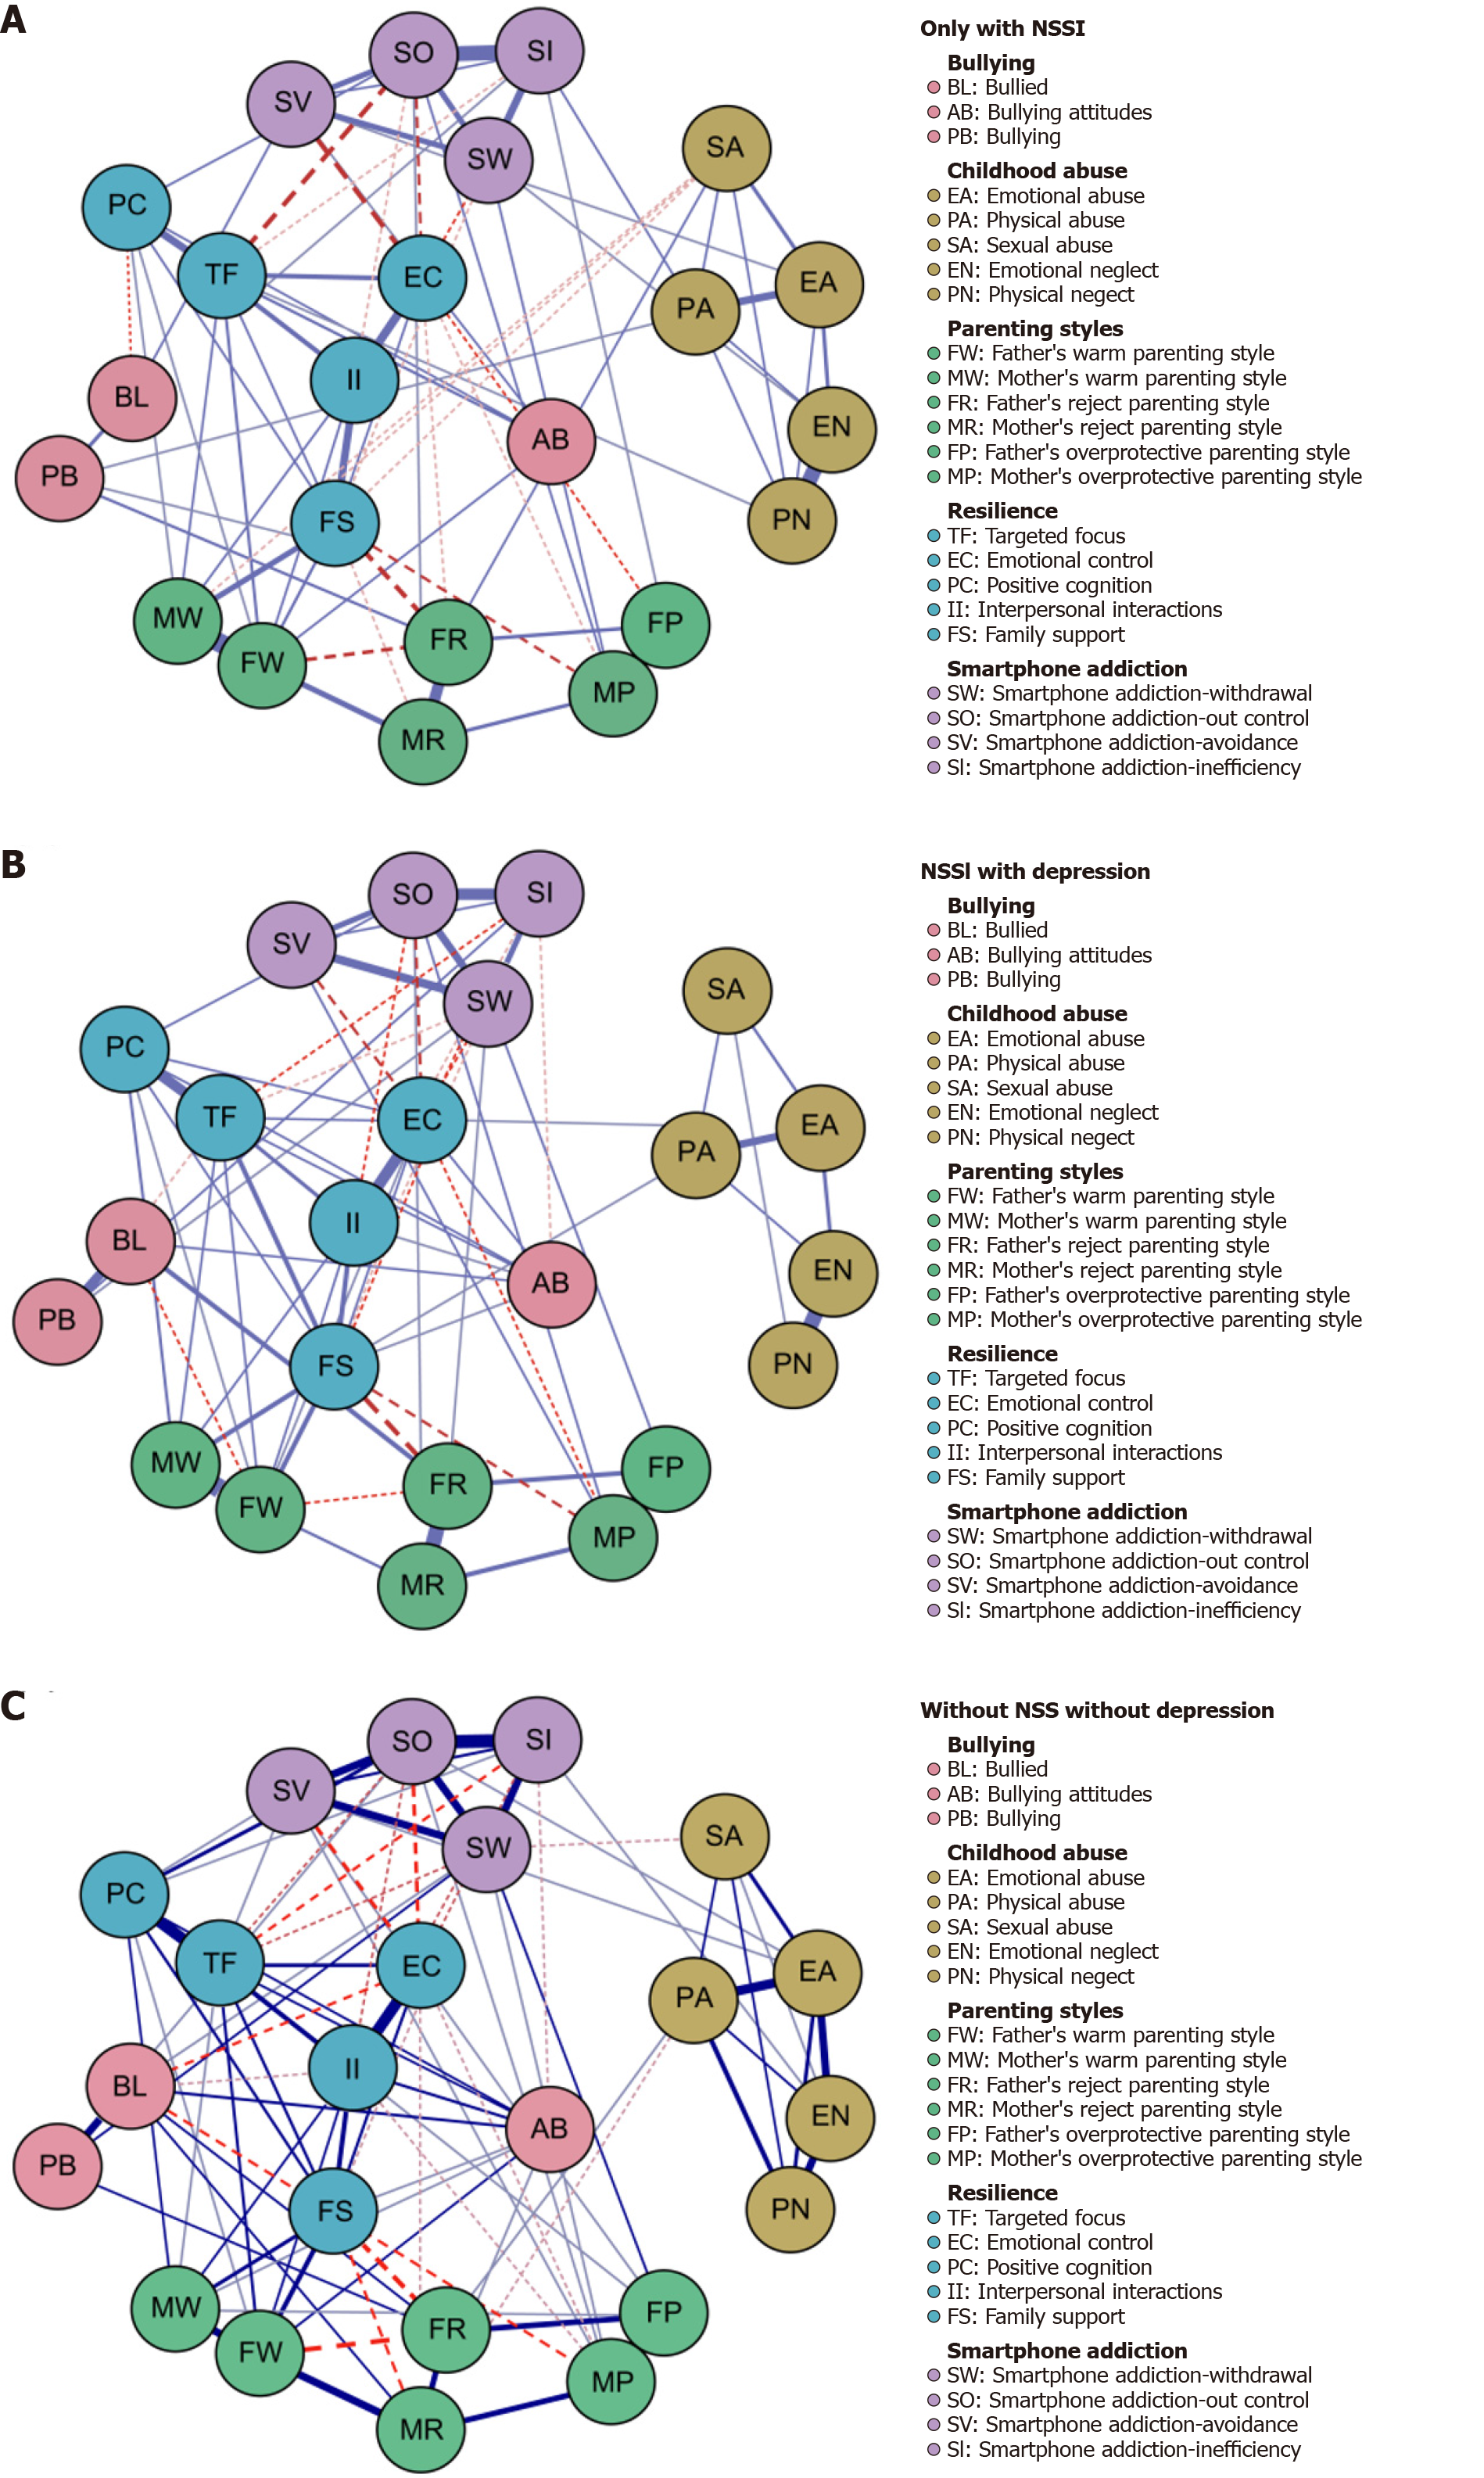
Figure 1 Regularized partial correlation influence factor-resilience network across three subgroups: Edge thickness represents the strength of association.
Blue (solid) lines indicate positive relationships, whereas red (dashed) lines indicate negative relationships. Only edges with weights greater than 0.05 are displayed. Edge weights are scaled according to the maximum edge weight across all points (0.65). A: Subgroup designations: Non-suicidal self-injury (NSSI)-without depression (ND); B: Subgroup designations: NSSI-with depression; C: Subgroup designations: No NSSI-ND.
- Citation: Yang W, Lian K, Cheng YQ, Xu XF, Duan XC, You X. Network analysis of adolescent non-suicidal self-injury subgroups identified through latent profile analysis. World J Psychiatry 2024; 14(12): 1936-1946
- URL: https://www.wjgnet.com/2220-3206/full/v14/i12/1936.htm
- DOI: https://dx.doi.org/10.5498/wjp.v14.i12.1936


