Copyright
©The Author(s) 2024.
World J Psychiatry. Dec 19, 2024; 14(12): 1815-1826
Published online Dec 19, 2024. doi: 10.5498/wjp.v14.i12.1815
Published online Dec 19, 2024. doi: 10.5498/wjp.v14.i12.1815
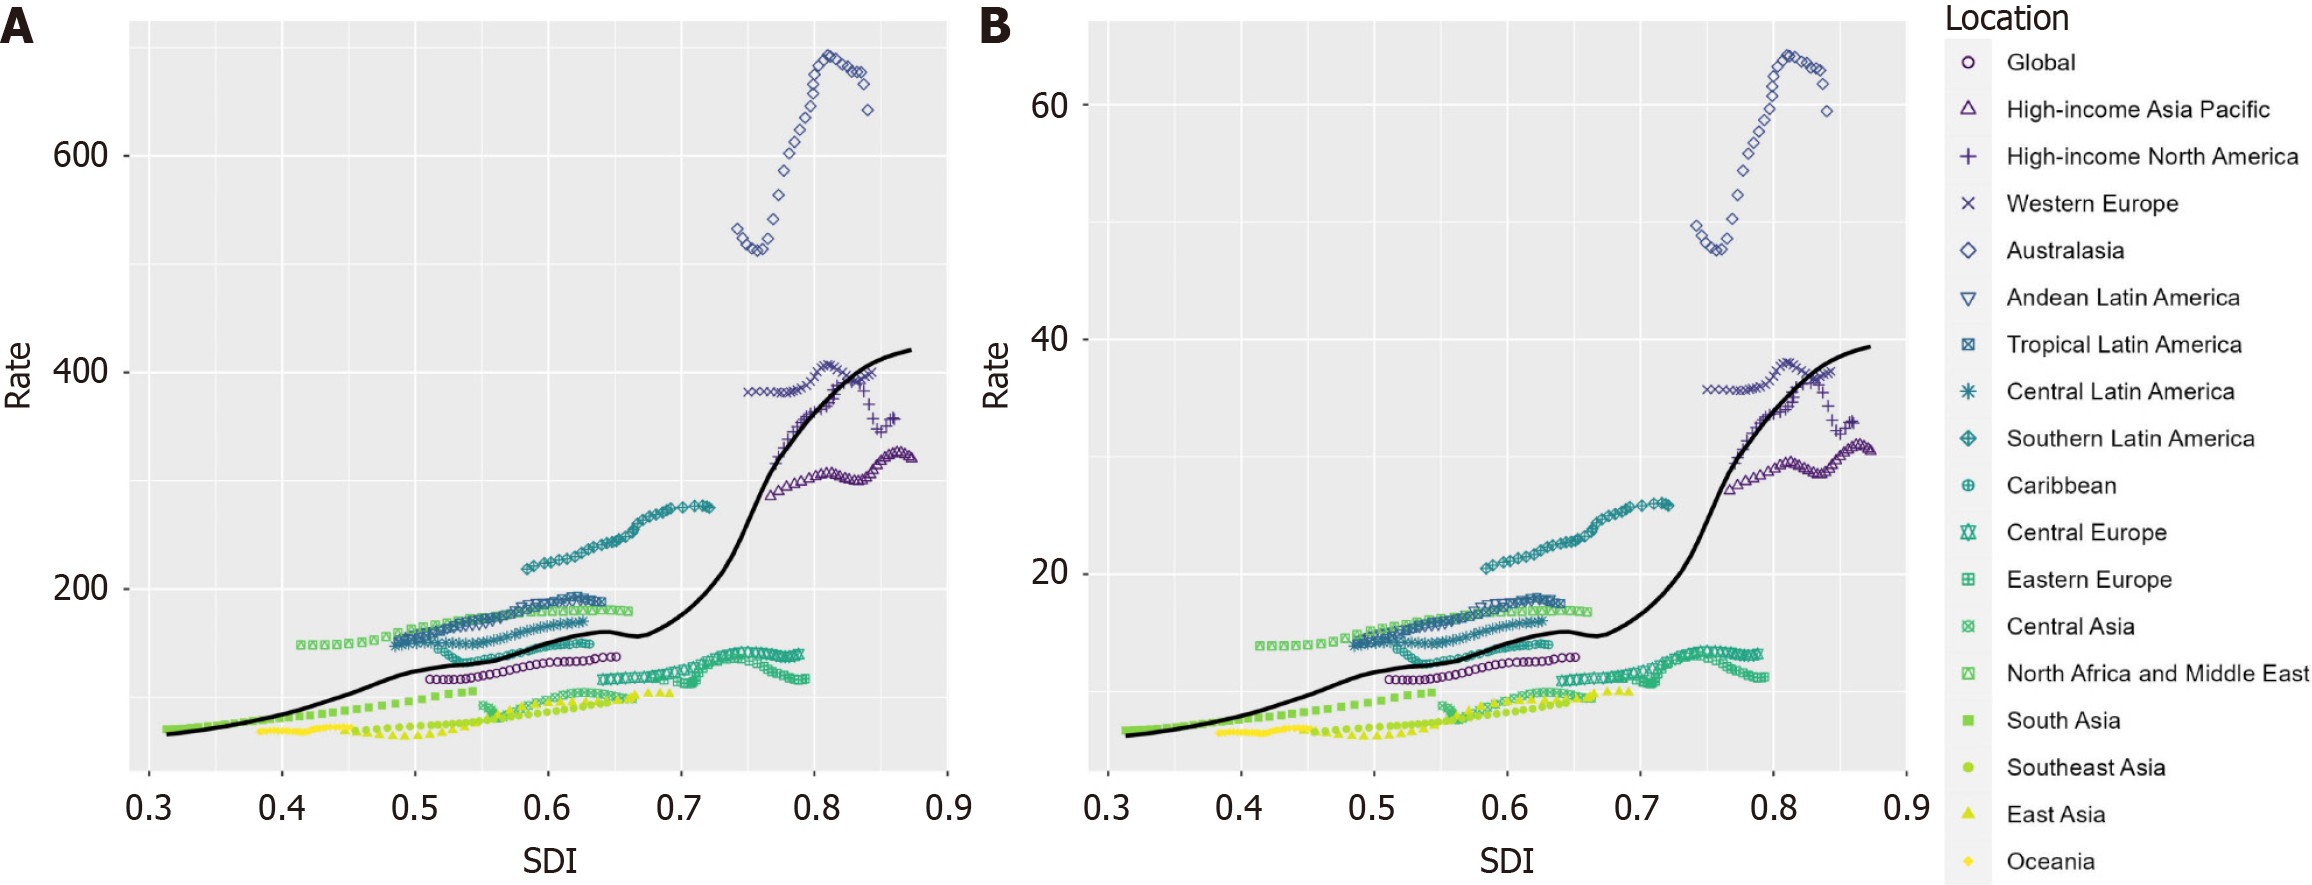
Figure 4 Rates of prevalence A and disability-adjusted life years B of eating disorders by sociodemographic index from 1990 to 2019, and expected value-based sociodemographic index.
A and B: The black line represents the average expected relationship between sociodemographic index and prevalence (A) or disability-adjusted life years (B) of eating disorders based on values from all regions from 1990 to 2019. SDI: Sociodemographic index.
- Citation: Chen Q, Huang S, Peng JY, Xu H, Wang P, Shi XM, Li SQ, Luo R, Zhang W, Shi L, Peng Y, Wang XH, Tang XW. Trends and prevalence of eating disorders in children and adolescents. World J Psychiatry 2024; 14(12): 1815-1826
- URL: https://www.wjgnet.com/2220-3206/full/v14/i12/1815.htm
- DOI: https://dx.doi.org/10.5498/wjp.v14.i12.1815


