Copyright
©The Author(s) 2024.
World J Psychiatry. Nov 19, 2024; 14(11): 1696-1707
Published online Nov 19, 2024. doi: 10.5498/wjp.v14.i11.1696
Published online Nov 19, 2024. doi: 10.5498/wjp.v14.i11.1696
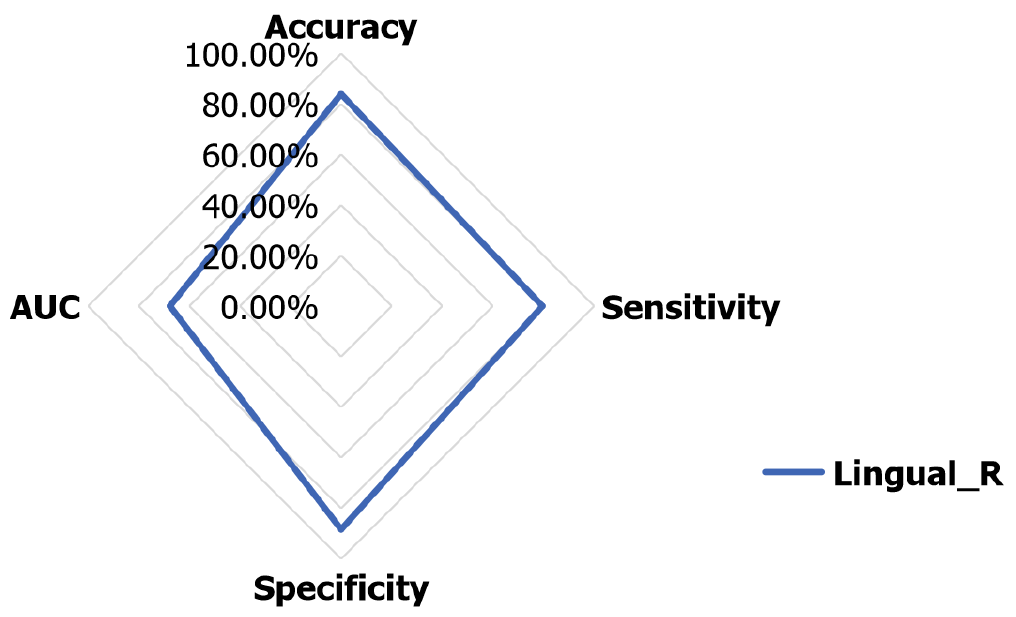
Figure 6
Radar map showing the accuracy, sensitivity, and specificity of the use of the functional connectivity value in the right lingual gyrus for distinguishing between patients with major depressive disorder patients and the healthy controls, together with the corresponding area under the curve values.
- Citation: Yu ZH, Yu RQ, Wang XY, Ren WY, Zhang XQ, Wu W, Li X, Dai LQ, Lv YL. Resting-state functional magnetic resonance imaging and support vector machines for the diagnosis of major depressive disorder in adolescents. World J Psychiatry 2024; 14(11): 1696-1707
- URL: https://www.wjgnet.com/2220-3206/full/v14/i11/1696.htm
- DOI: https://dx.doi.org/10.5498/wjp.v14.i11.1696


