Copyright
©The Author(s) 2024.
World J Psychiatry. Nov 19, 2024; 14(11): 1696-1707
Published online Nov 19, 2024. doi: 10.5498/wjp.v14.i11.1696
Published online Nov 19, 2024. doi: 10.5498/wjp.v14.i11.1696
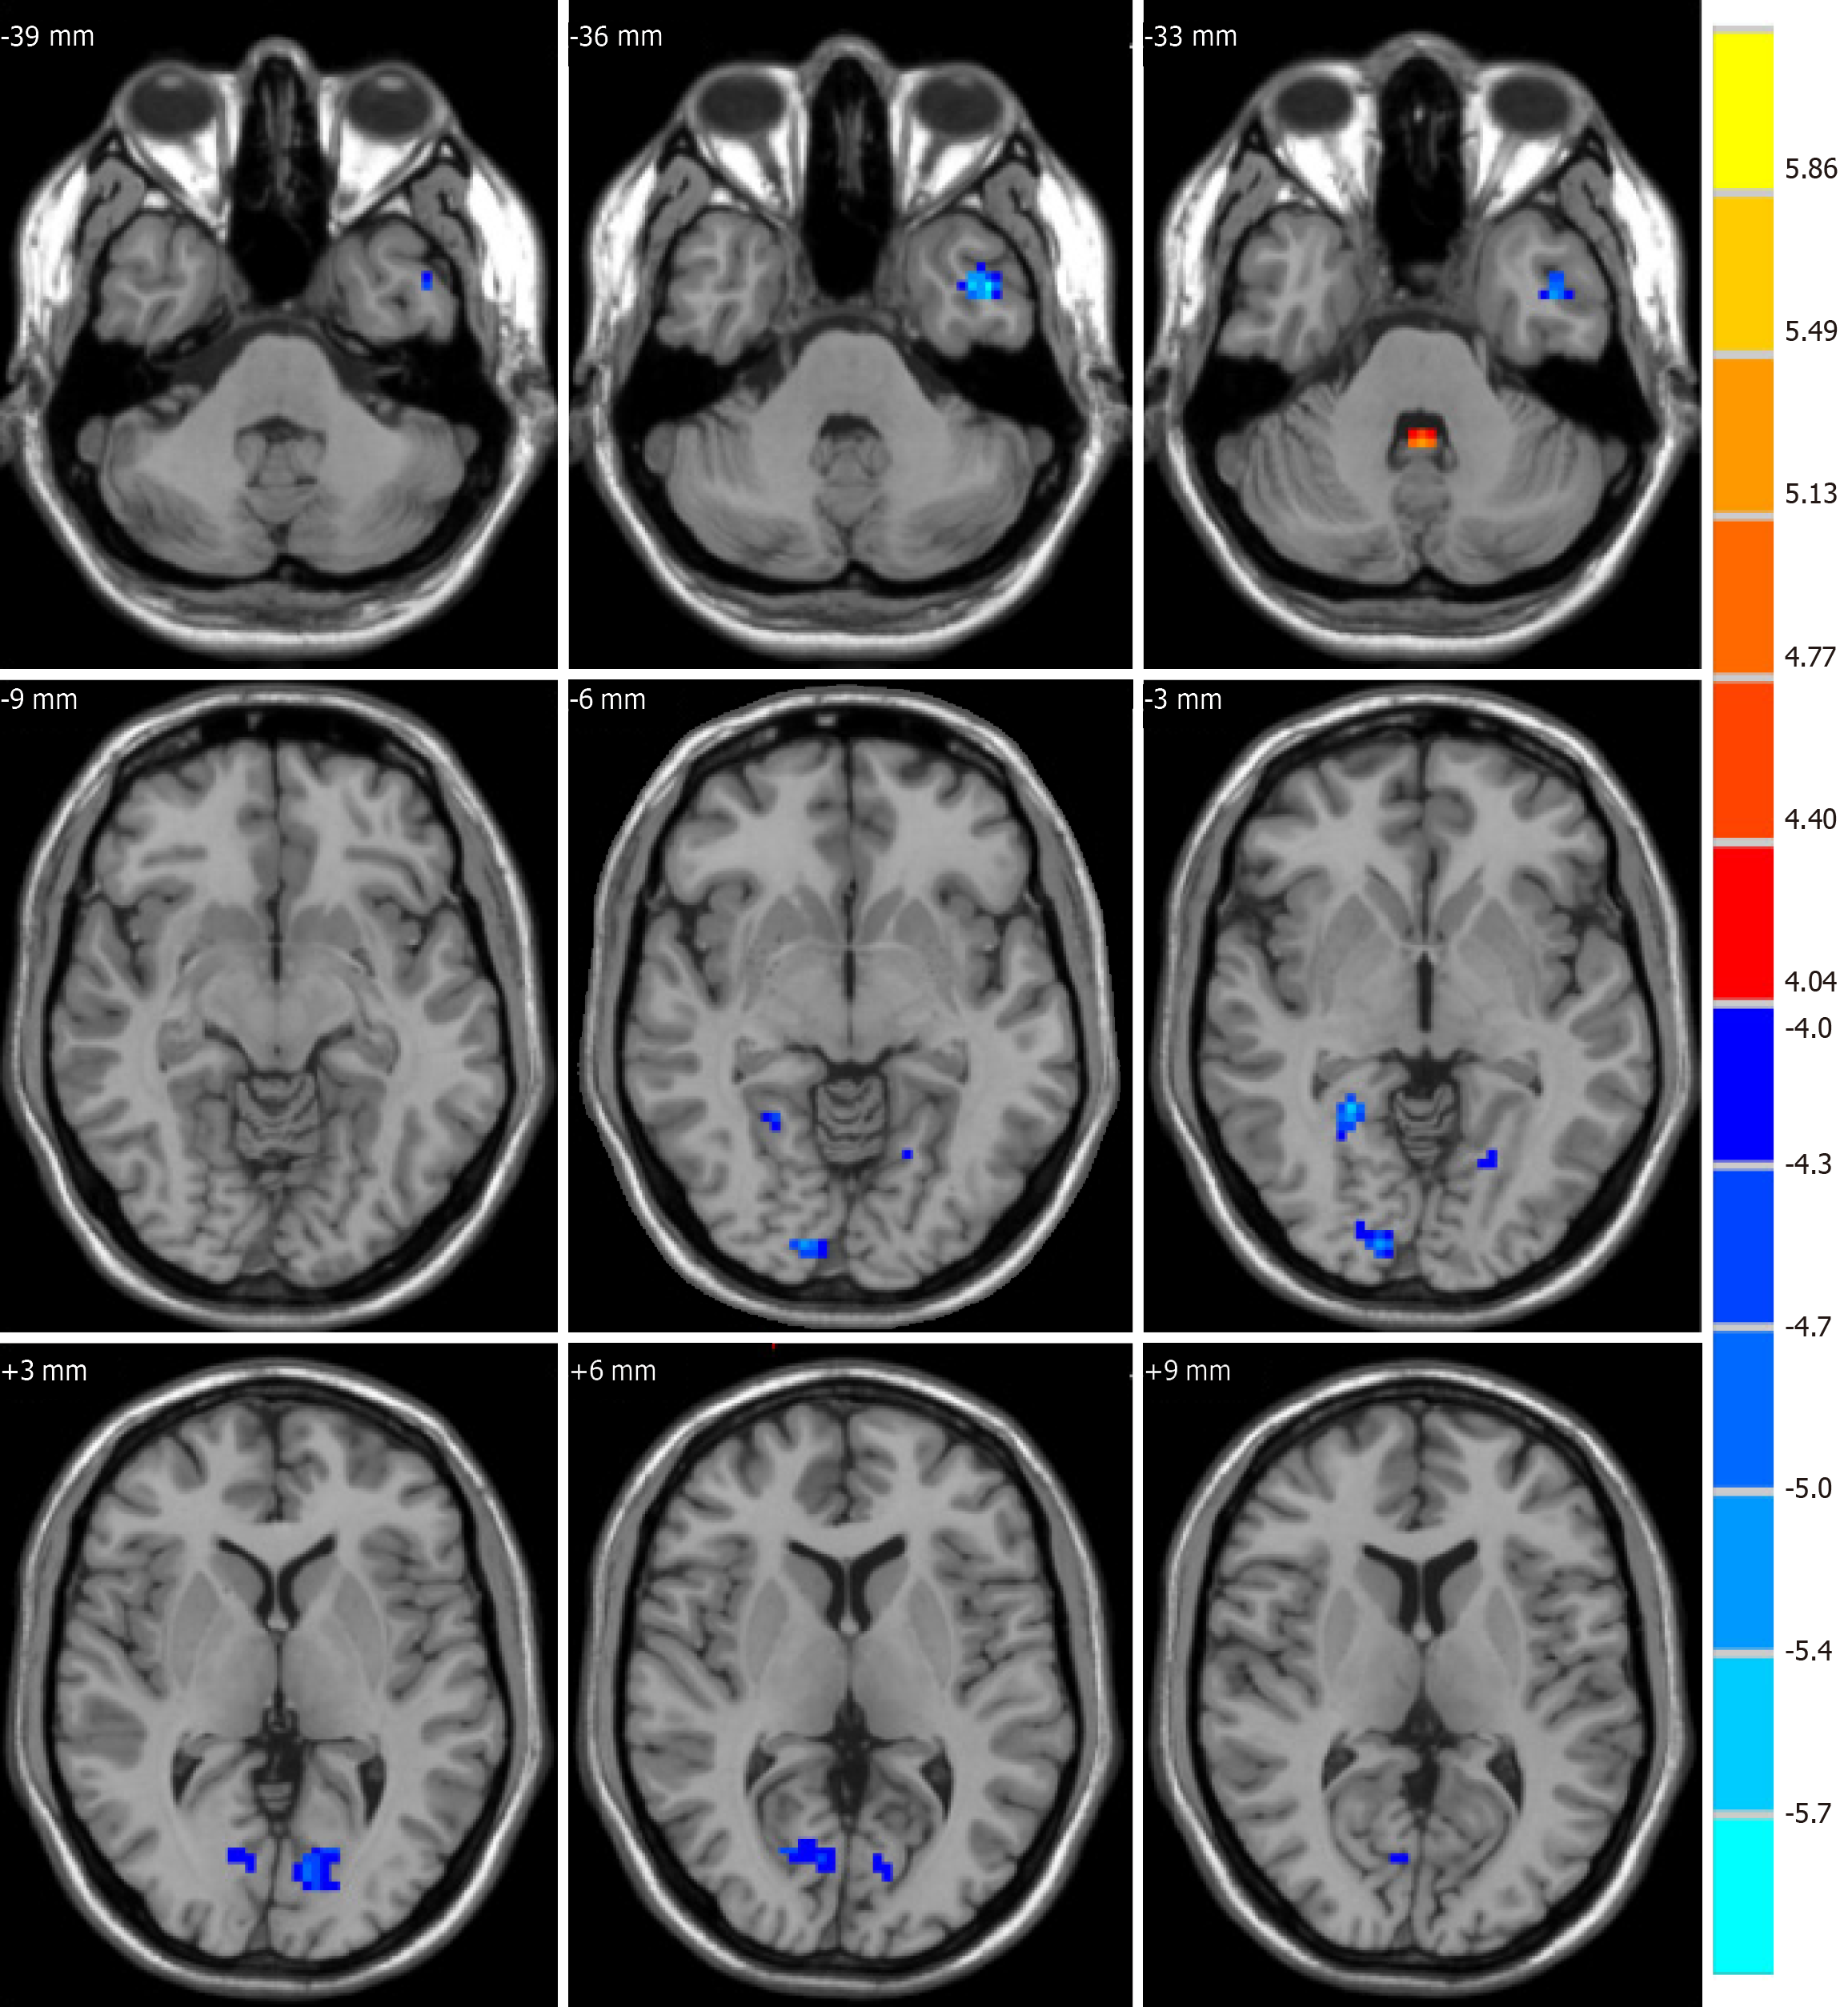
Figure 2 Differences in functional connectivity values between patients with major depressive disorder patients and the healthy controls.
The color bar represents the t-values in the group analysis.
- Citation: Yu ZH, Yu RQ, Wang XY, Ren WY, Zhang XQ, Wu W, Li X, Dai LQ, Lv YL. Resting-state functional magnetic resonance imaging and support vector machines for the diagnosis of major depressive disorder in adolescents. World J Psychiatry 2024; 14(11): 1696-1707
- URL: https://www.wjgnet.com/2220-3206/full/v14/i11/1696.htm
- DOI: https://dx.doi.org/10.5498/wjp.v14.i11.1696


