Copyright
©The Author(s) 2023.
World J Psychiatry. Aug 19, 2023; 13(8): 511-523
Published online Aug 19, 2023. doi: 10.5498/wjp.v13.i8.511
Published online Aug 19, 2023. doi: 10.5498/wjp.v13.i8.511
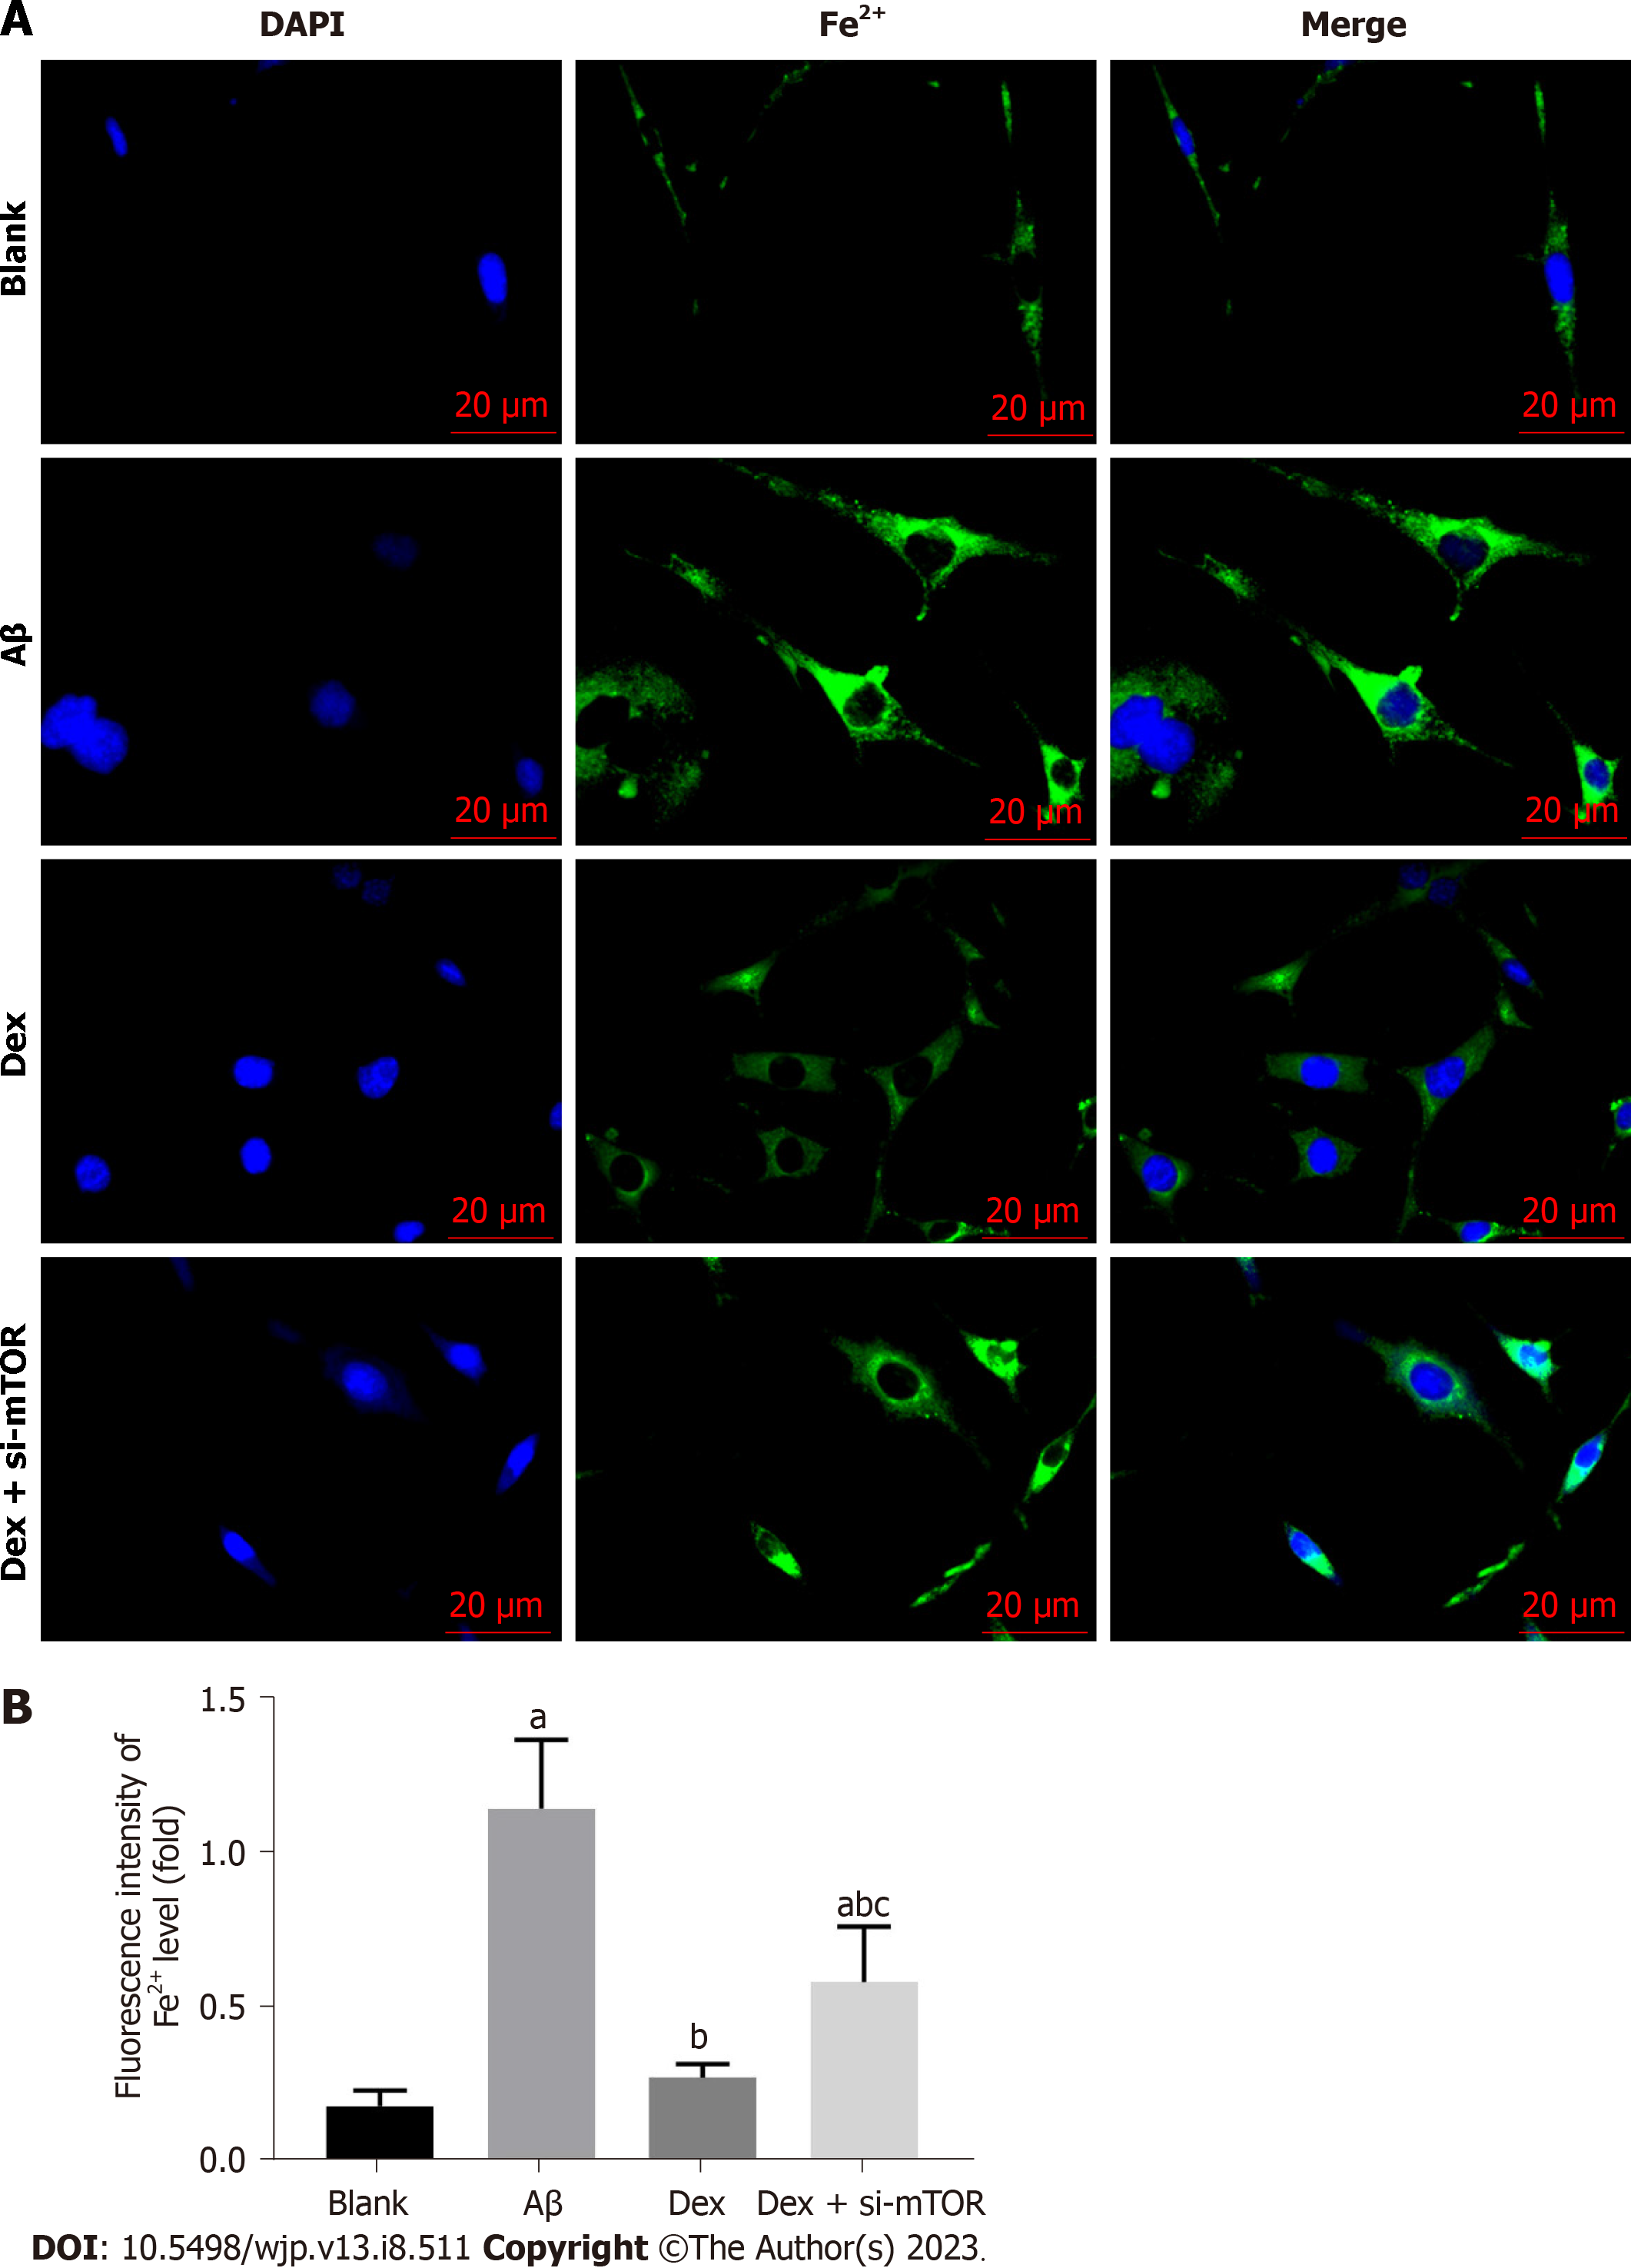
Figure 2 Comparison of the level of Fe2+ in mouse hippocampal neurons in the different treatment groups.
A: Green fluorescence represents intracellular iron levels, and quenching of calcein fluorescence reflects iron uptake by chondrocytes. Scale bar: 20 μm; B: Fluorescence intensity. aP < 0.05, compared with the blank group; bP < 0.05, compared with the amyloid β group; cP < 0.05, compared with the dexmedetomidine group. Aβ: Amyloid β; Dex: Dexmedetomidine; si-mTOR: Mammalian target of rapamycin siRNA; DAPI: 4’,6-diamidino-2-phenylindole.
- Citation: Qiao L, Li G, Yuan HX. Dexmedetomidine mediates the mechanism of action of ferroptosis in mice with Alzheimer’s disease by regulating the mTOR-TFR1 pathway. World J Psychiatry 2023; 13(8): 511-523
- URL: https://www.wjgnet.com/2220-3206/full/v13/i8/511.htm
- DOI: https://dx.doi.org/10.5498/wjp.v13.i8.511


