Copyright
©The Author(s) 2023.
World J Psychiatry. May 19, 2023; 13(5): 234-246
Published online May 19, 2023. doi: 10.5498/wjp.v13.i5.234
Published online May 19, 2023. doi: 10.5498/wjp.v13.i5.234
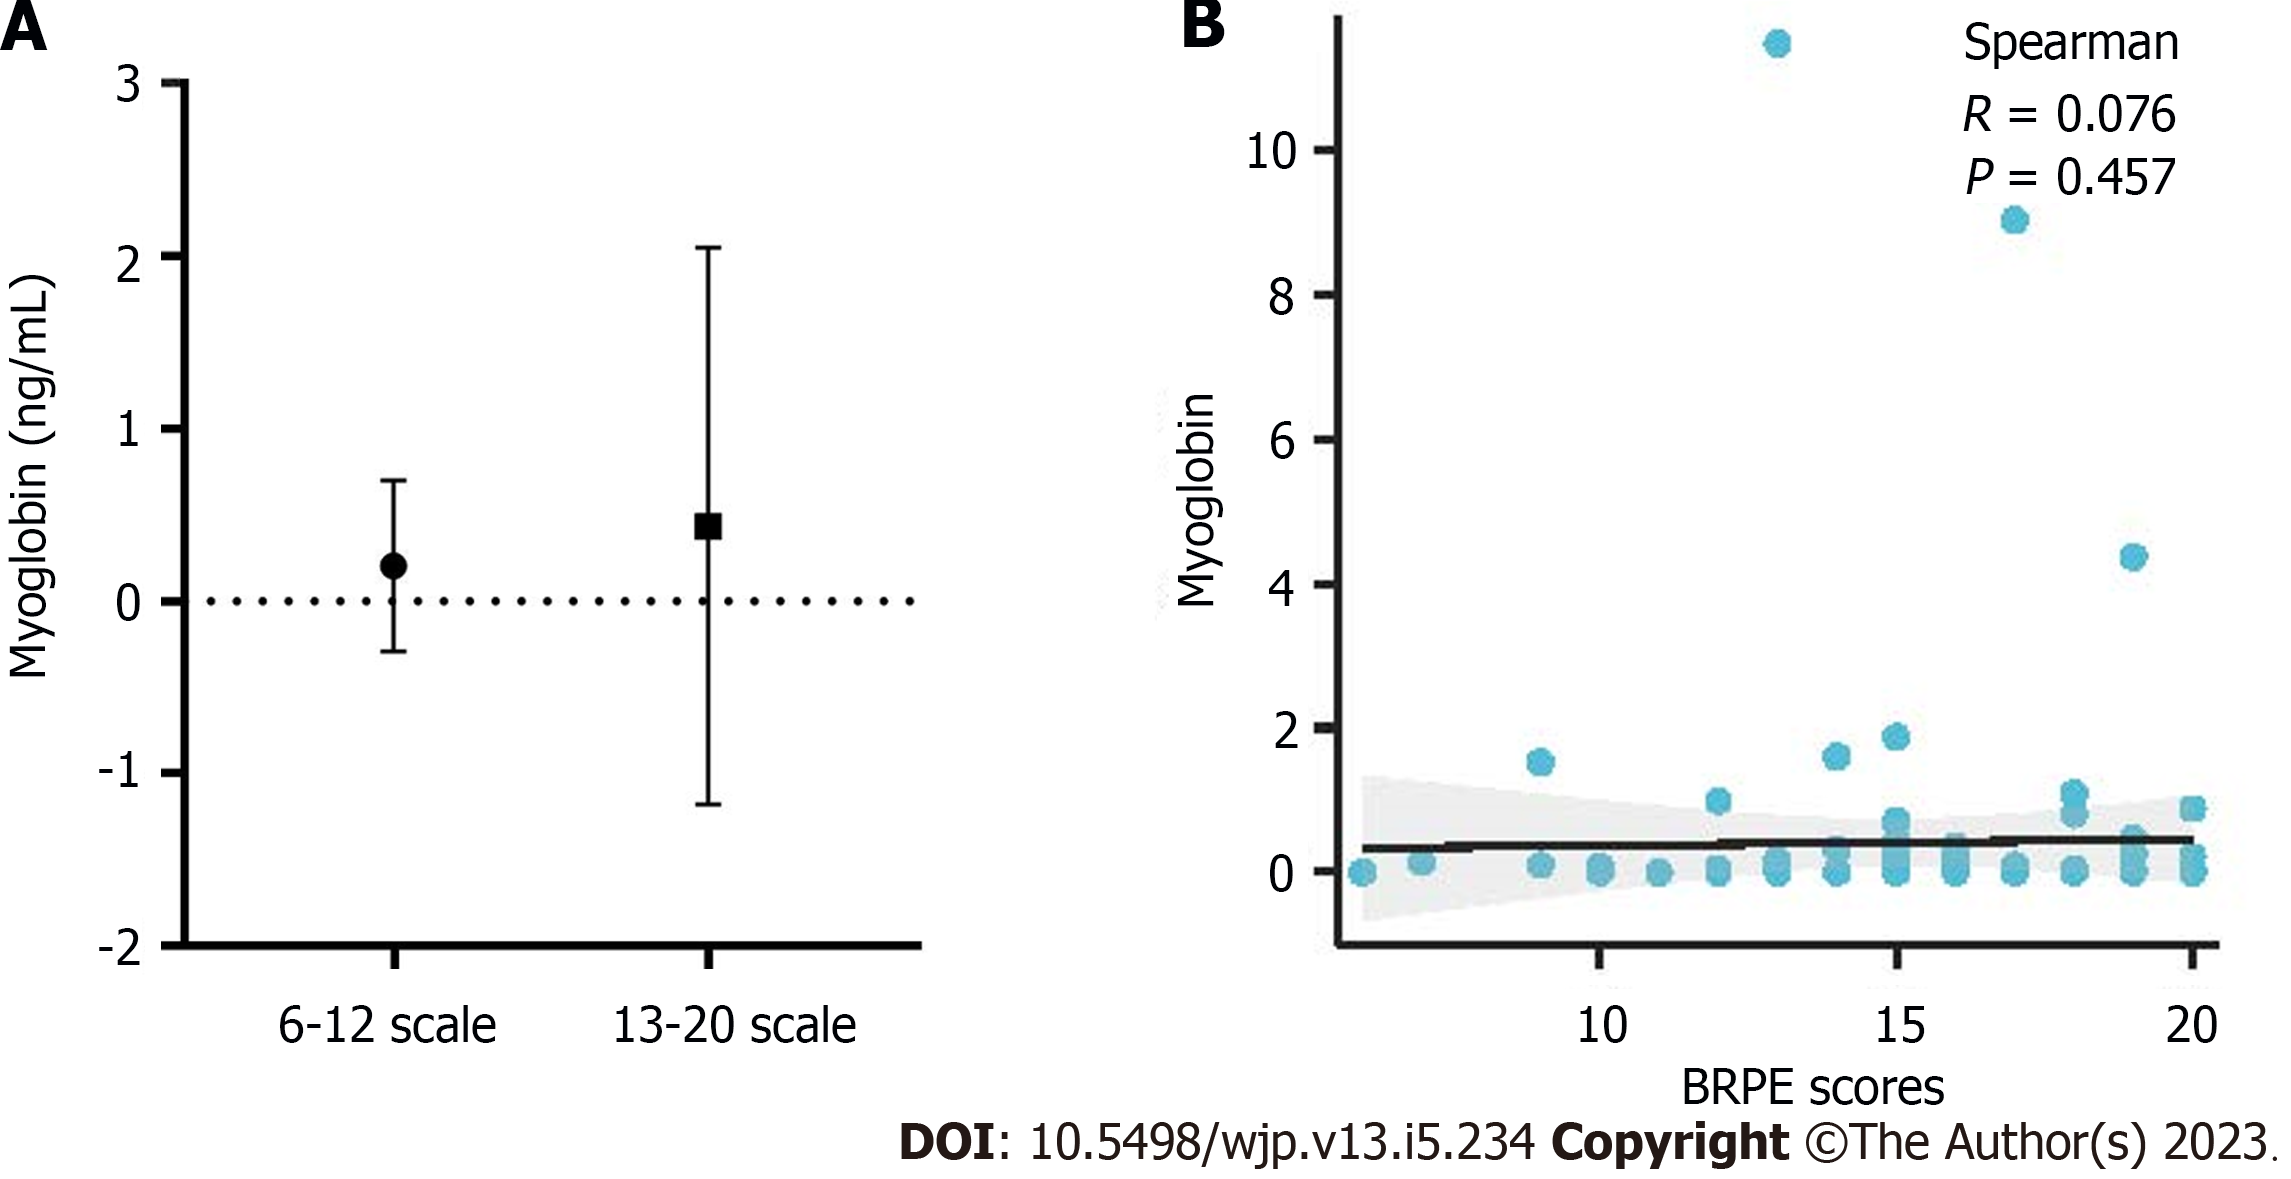
Figure 7 Correlation analysis between Borg’s rating of perceived exertion scale and myoglobin levels.
A: Statistical analysis between the groups with scores of 6-12 and 13-20; B: Spearman’s correlation analysis between the Borg’s rating of perceived exertion scale and myoglobin levels. BRPE: Borg’s rating of perceived exertion.
- Citation: Sang PP, Li J, Tan XD, Peng W, Zhou HH, Tian YP, Zhang ML. Associations between Borg’s rating of perceived exertion and changes in urinary organic acid metabolites after outdoor weight-bearing hiking. World J Psychiatry 2023; 13(5): 234-246
- URL: https://www.wjgnet.com/2220-3206/full/v13/i5/234.htm
- DOI: https://dx.doi.org/10.5498/wjp.v13.i5.234


