Copyright
©The Author(s) 2023.
World J Psychiatry. May 19, 2023; 13(5): 191-202
Published online May 19, 2023. doi: 10.5498/wjp.v13.i5.191
Published online May 19, 2023. doi: 10.5498/wjp.v13.i5.191
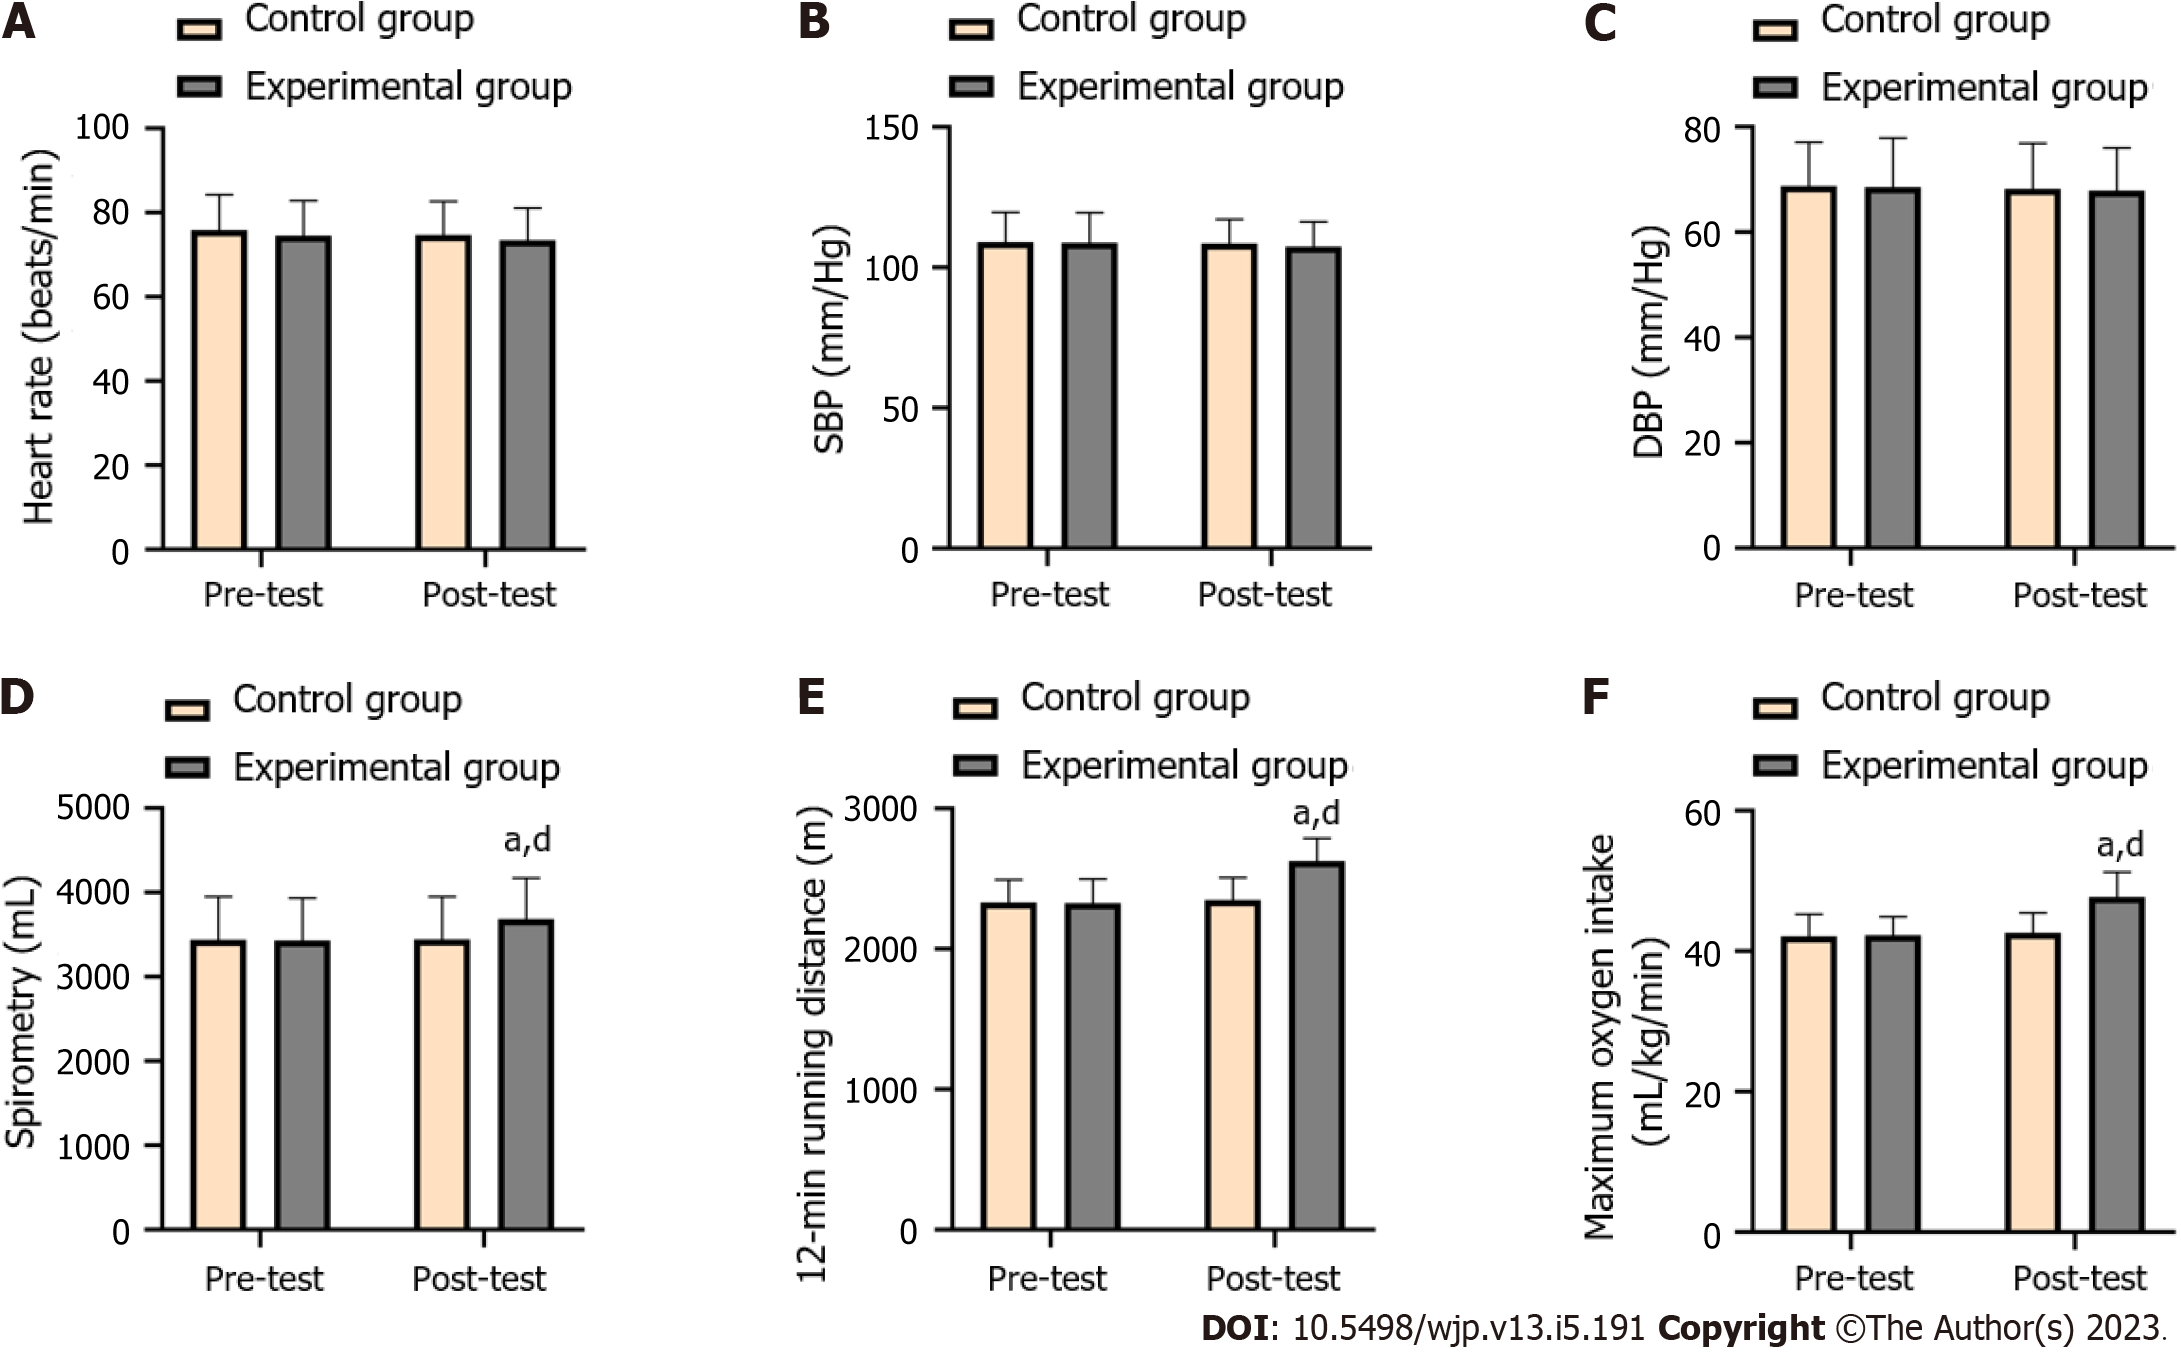
Figure 4 Comparison of cardiopulmonary function between the two groups before and after the experiment.
A: Heart rate (beats/min); B: Systolic blood pressure (mm/Hg); C: Diastolic blood pressure (mm/Hg); D: Spirometry (mL); E: 12-min running distance (m); F: Maximum oxygen intake (mL/kg/min). aP < 0.05 vs the same group before teaching. dP < 0.05 vs the control group after teaching. SBP: Systolic blood pressure; DBP: Diastolic blood pressure.
- Citation: Zhong XL, Sheng DL, Cheng TZ, Zhang ZW. Effect of exercise prescription teaching on exercise quality and mental health status of college students. World J Psychiatry 2023; 13(5): 191-202
- URL: https://www.wjgnet.com/2220-3206/full/v13/i5/191.htm
- DOI: https://dx.doi.org/10.5498/wjp.v13.i5.191


