Copyright
©The Author(s) 2023.
World J Psychiatry. Feb 19, 2023; 13(2): 36-49
Published online Feb 19, 2023. doi: 10.5498/wjp.v13.i2.36
Published online Feb 19, 2023. doi: 10.5498/wjp.v13.i2.36
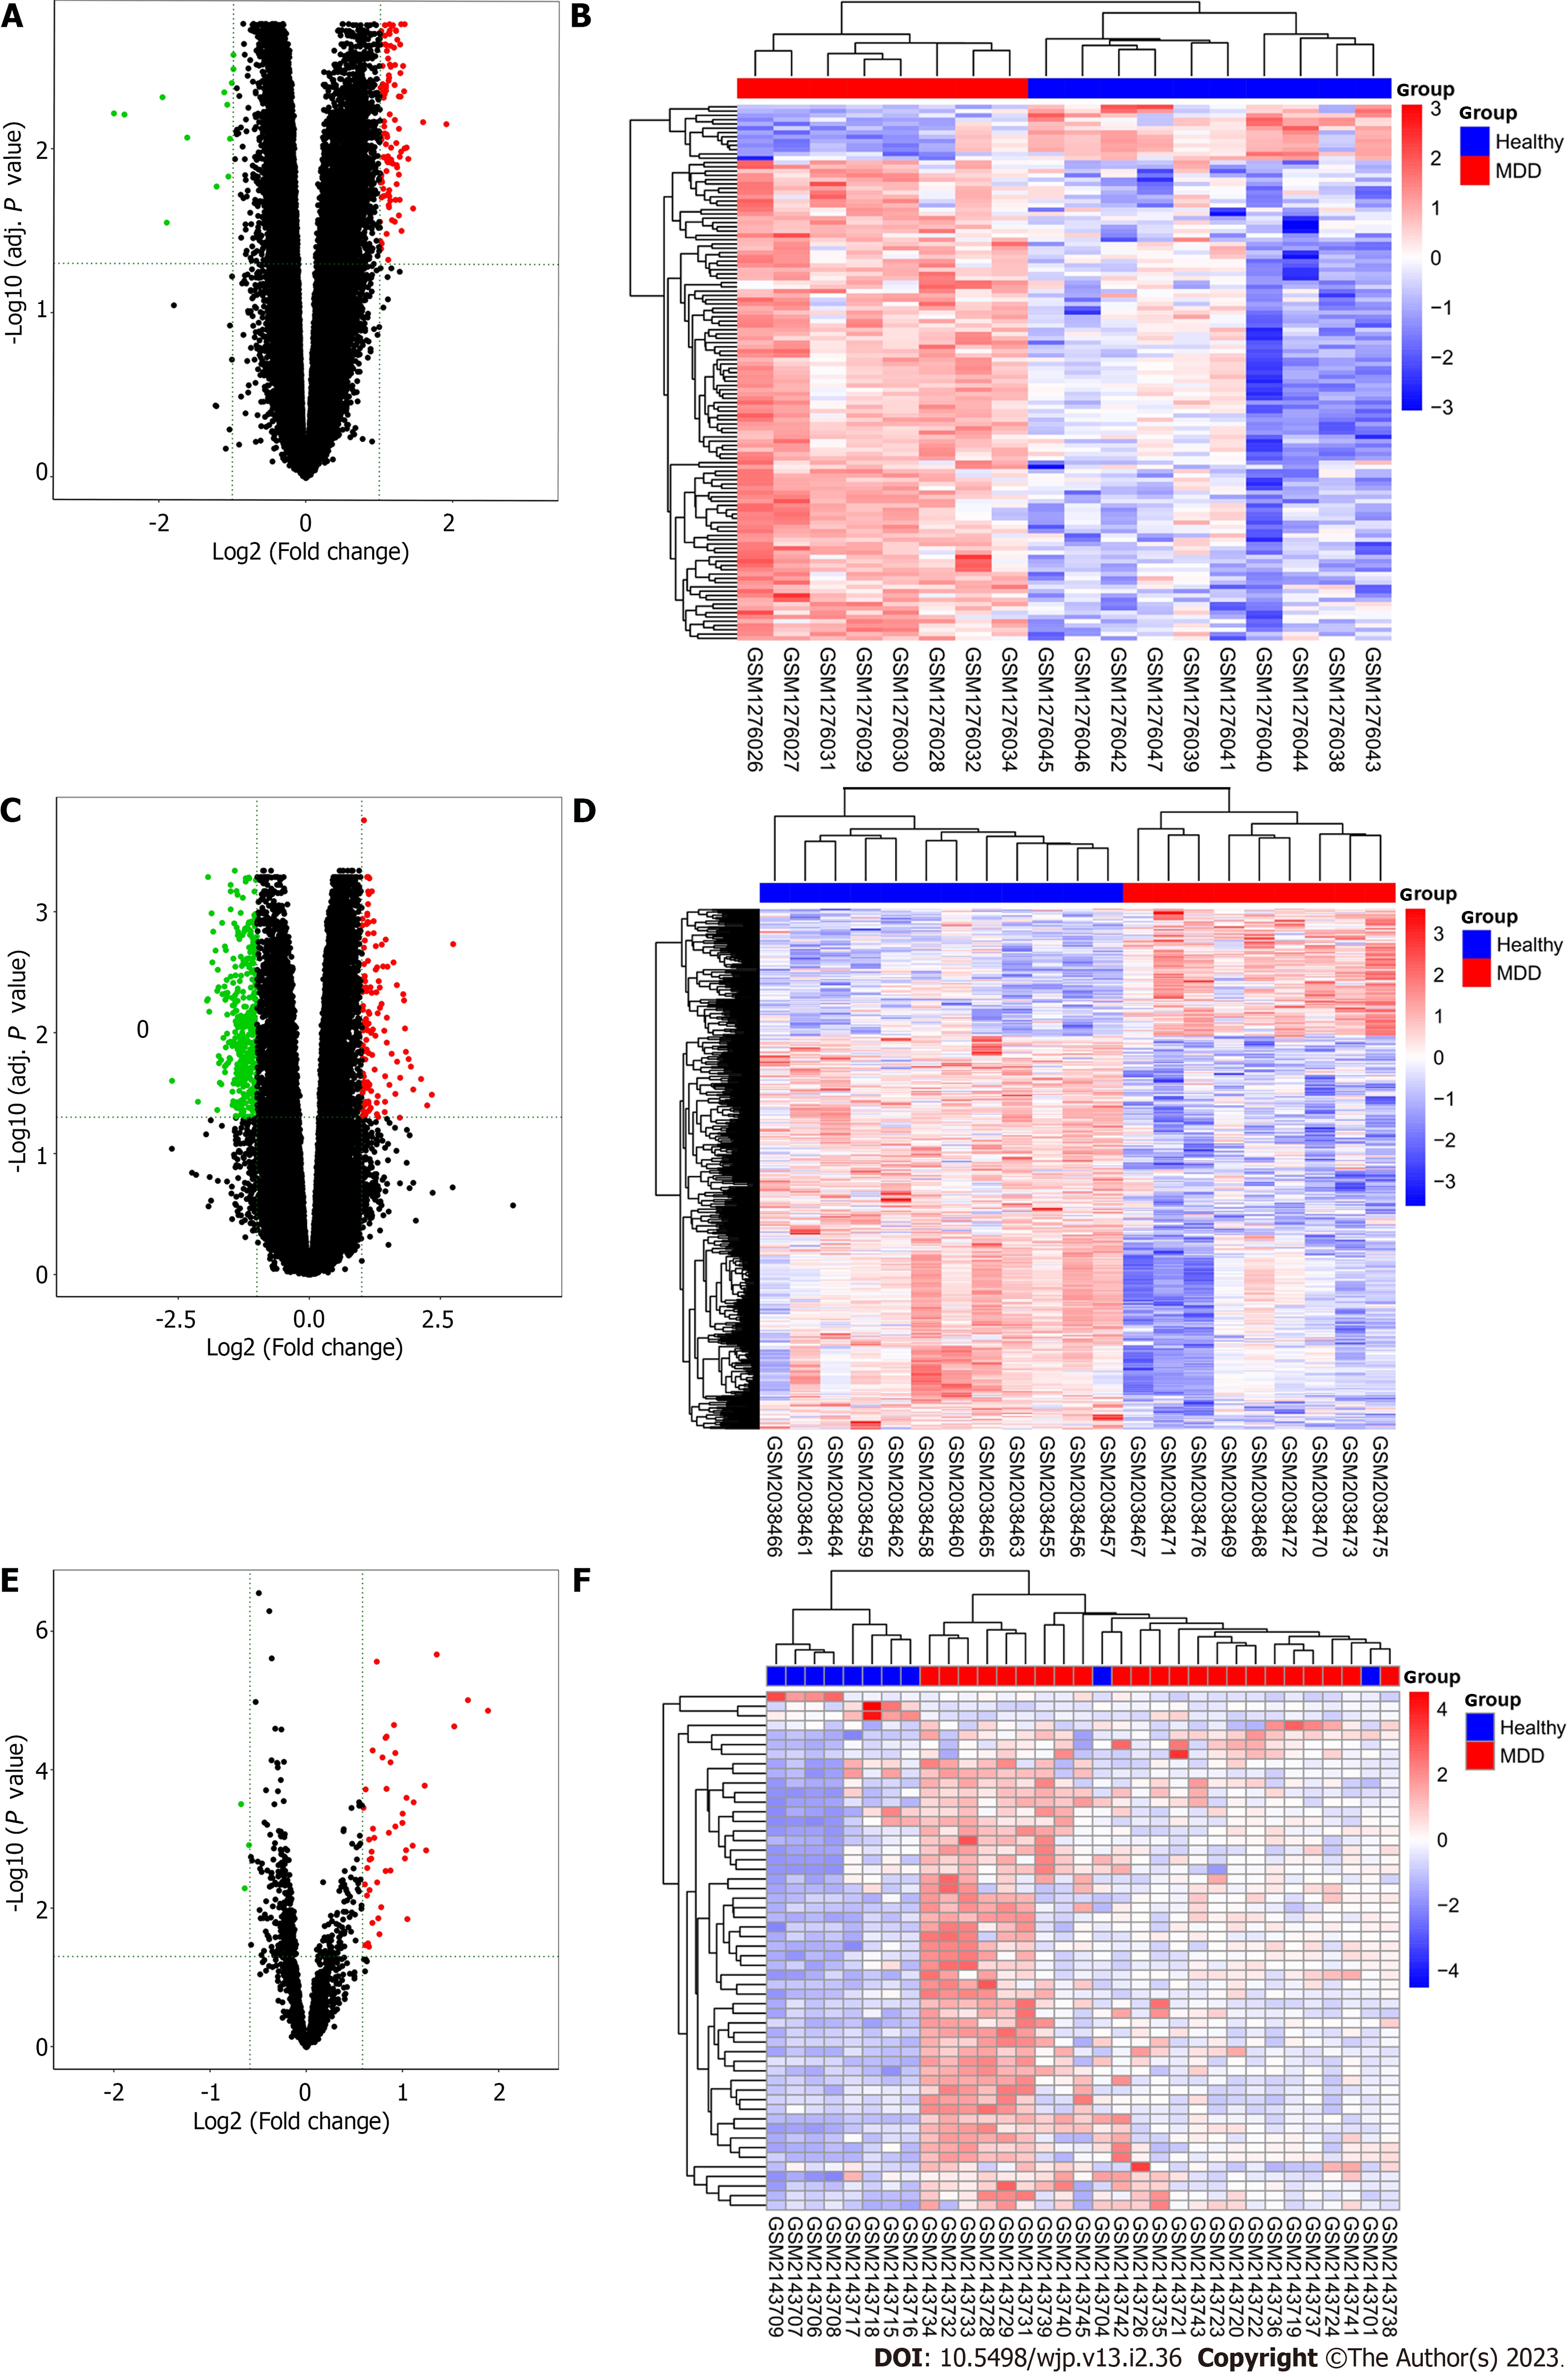
Figure 2 Difference and cluster analyses.
A: Volcanic maps of differentially expressed genes in GSE52790; B: Cluster analysis heatmap of the expression patterns of the differentially expressed genes in GSE52790; C: Volcanic maps of differentially expressed genes in GSE76826; D: Cluster analysis heatmap of the expression patterns of the differentially expressed genes in GSE76826; E: Volcanic maps of differentially expressed genes in GSE81152; F: Cluster analysis heatmap of the expression patterns of the differentially expressed genes in GSE81152. Red indicates upregulated genes; green indicates downregulated genes.
- Citation: Zou ZL, Ye Y, Zhou B, Zhang Y. Identification and characterization of noncoding RNAs-associated competing endogenous RNA networks in major depressive disorder. World J Psychiatry 2023; 13(2): 36-49
- URL: https://www.wjgnet.com/2220-3206/full/v13/i2/36.htm
- DOI: https://dx.doi.org/10.5498/wjp.v13.i2.36


