Copyright
©The Author(s) 2022.
World J Psychiatry. Aug 19, 2022; 12(8): 1031-1043
Published online Aug 19, 2022. doi: 10.5498/wjp.v12.i8.1031
Published online Aug 19, 2022. doi: 10.5498/wjp.v12.i8.1031
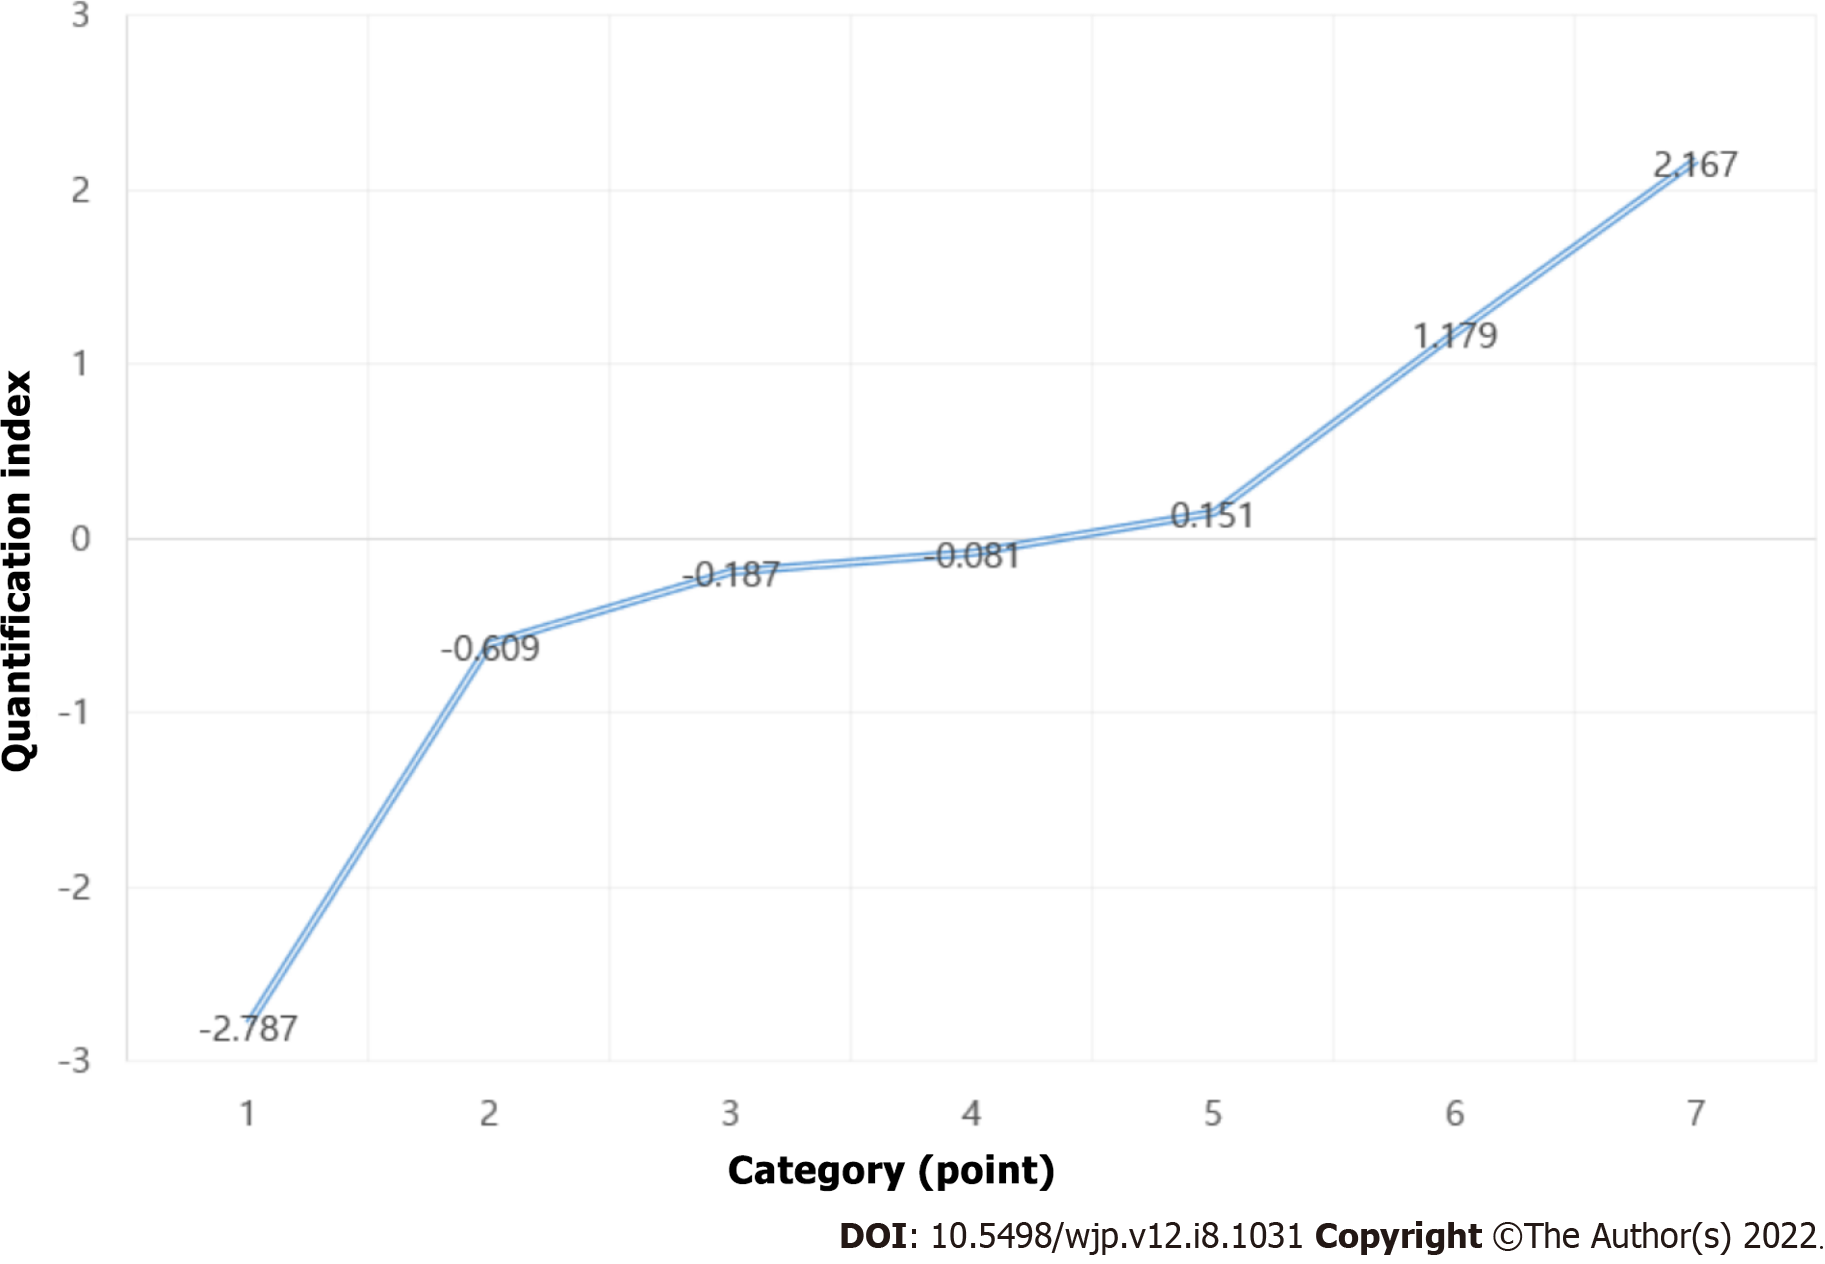
Figure 3 Quantification score graph among Hoehn and Yahr staging.
Category 1 = 1.0 point; Category 2 = 1.5 point; Category 3 = 2.0 point; Category 4 = 2.5 point; Category 5 = 3.0 point; Category 6 = 4.0 point; Category 7=5.0 point.
- Citation: Byeon H. Can the prediction model using regression with optimal scale improve the power to predict the Parkinson's dementia? World J Psychiatry 2022; 12(8): 1031-1043
- URL: https://www.wjgnet.com/2220-3206/full/v12/i8/1031.htm
- DOI: https://dx.doi.org/10.5498/wjp.v12.i8.1031


