Copyright
©The Author(s) 2021.
World J Psychiatr. Aug 19, 2021; 11(8): 491-506
Published online Aug 19, 2021. doi: 10.5498/wjp.v11.i8.491
Published online Aug 19, 2021. doi: 10.5498/wjp.v11.i8.491
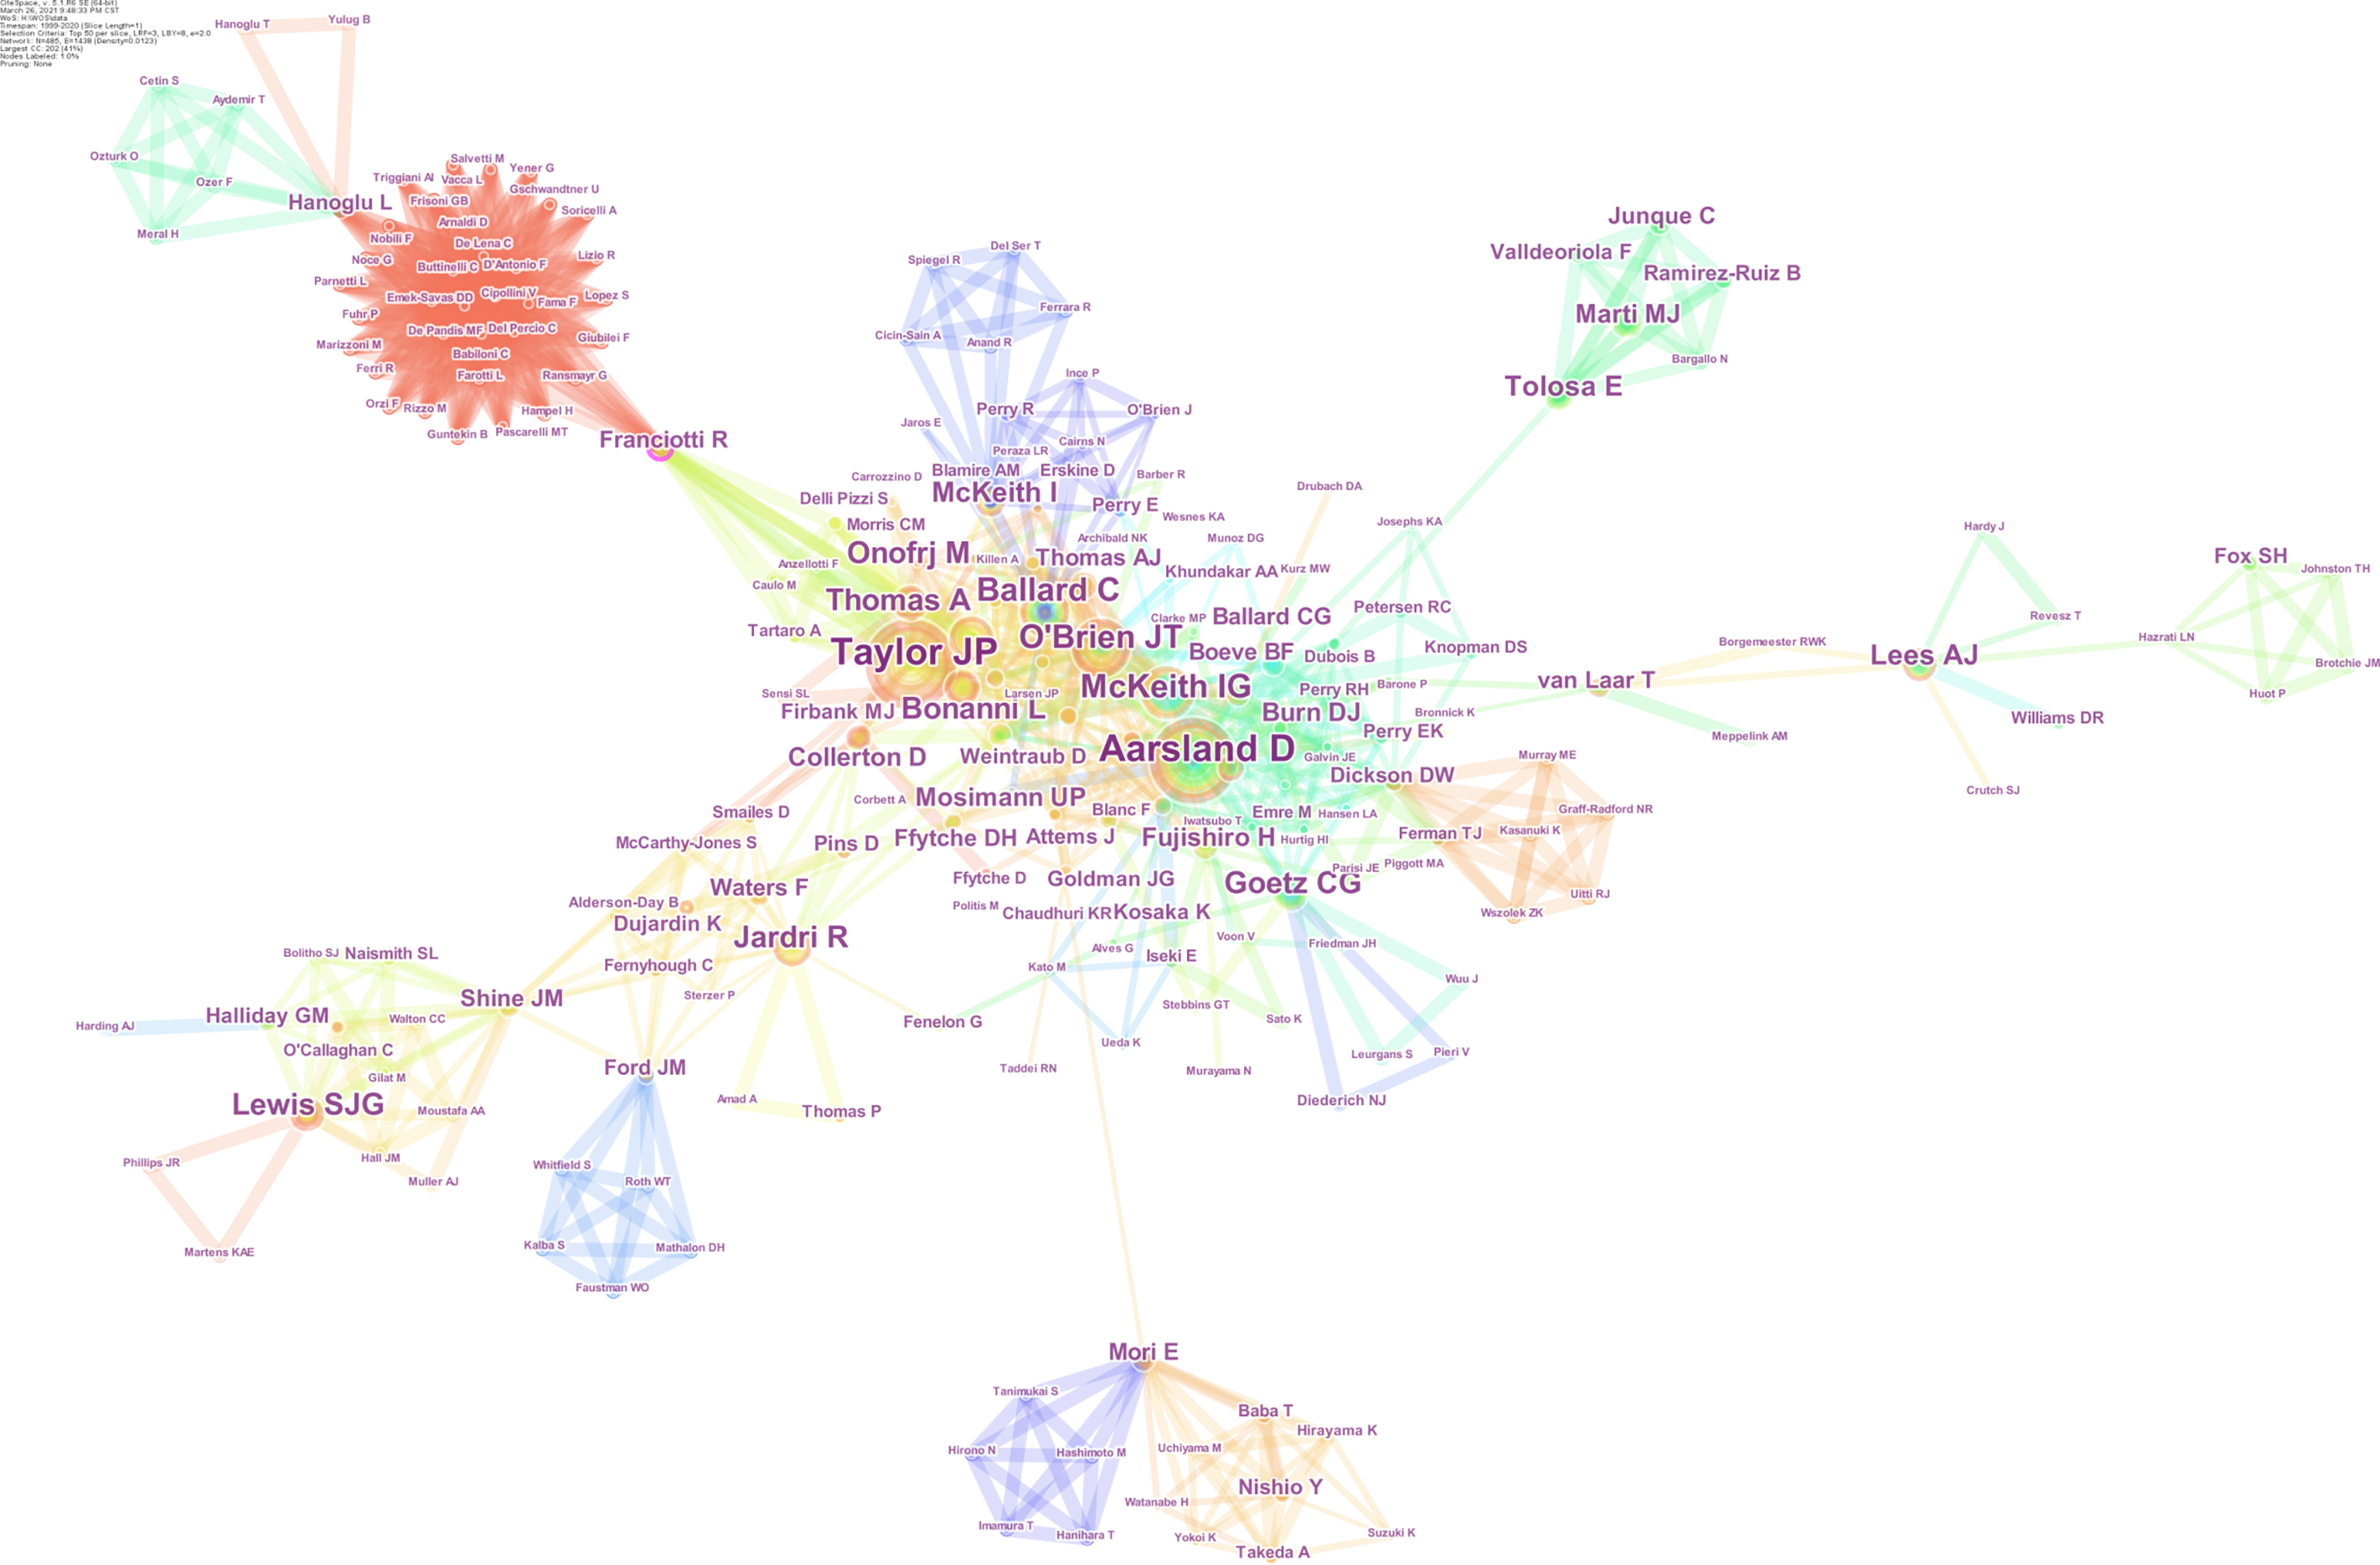
Figure 4 Map of active authors in the visual hallucination field.
The font size of each author’s name represents the article counts of each author. Different colors inside the circle represent different time intervals. The collaborative intensity between authors can be seen from the thickness of the connecting line.
- Citation: Zhong M, Wu Z, Jiang X, Shen B, Zhu J, Zhang L. Knowledge domain and emerging trends in visual hallucination research: A scientometric analysis. World J Psychiatr 2021; 11(8): 491-506
- URL: https://www.wjgnet.com/2220-3206/full/v11/i8/491.htm
- DOI: https://dx.doi.org/10.5498/wjp.v11.i8.491


