Copyright
©The Author(s) 2021.
World J Psychiatr. Aug 19, 2021; 11(8): 491-506
Published online Aug 19, 2021. doi: 10.5498/wjp.v11.i8.491
Published online Aug 19, 2021. doi: 10.5498/wjp.v11.i8.491
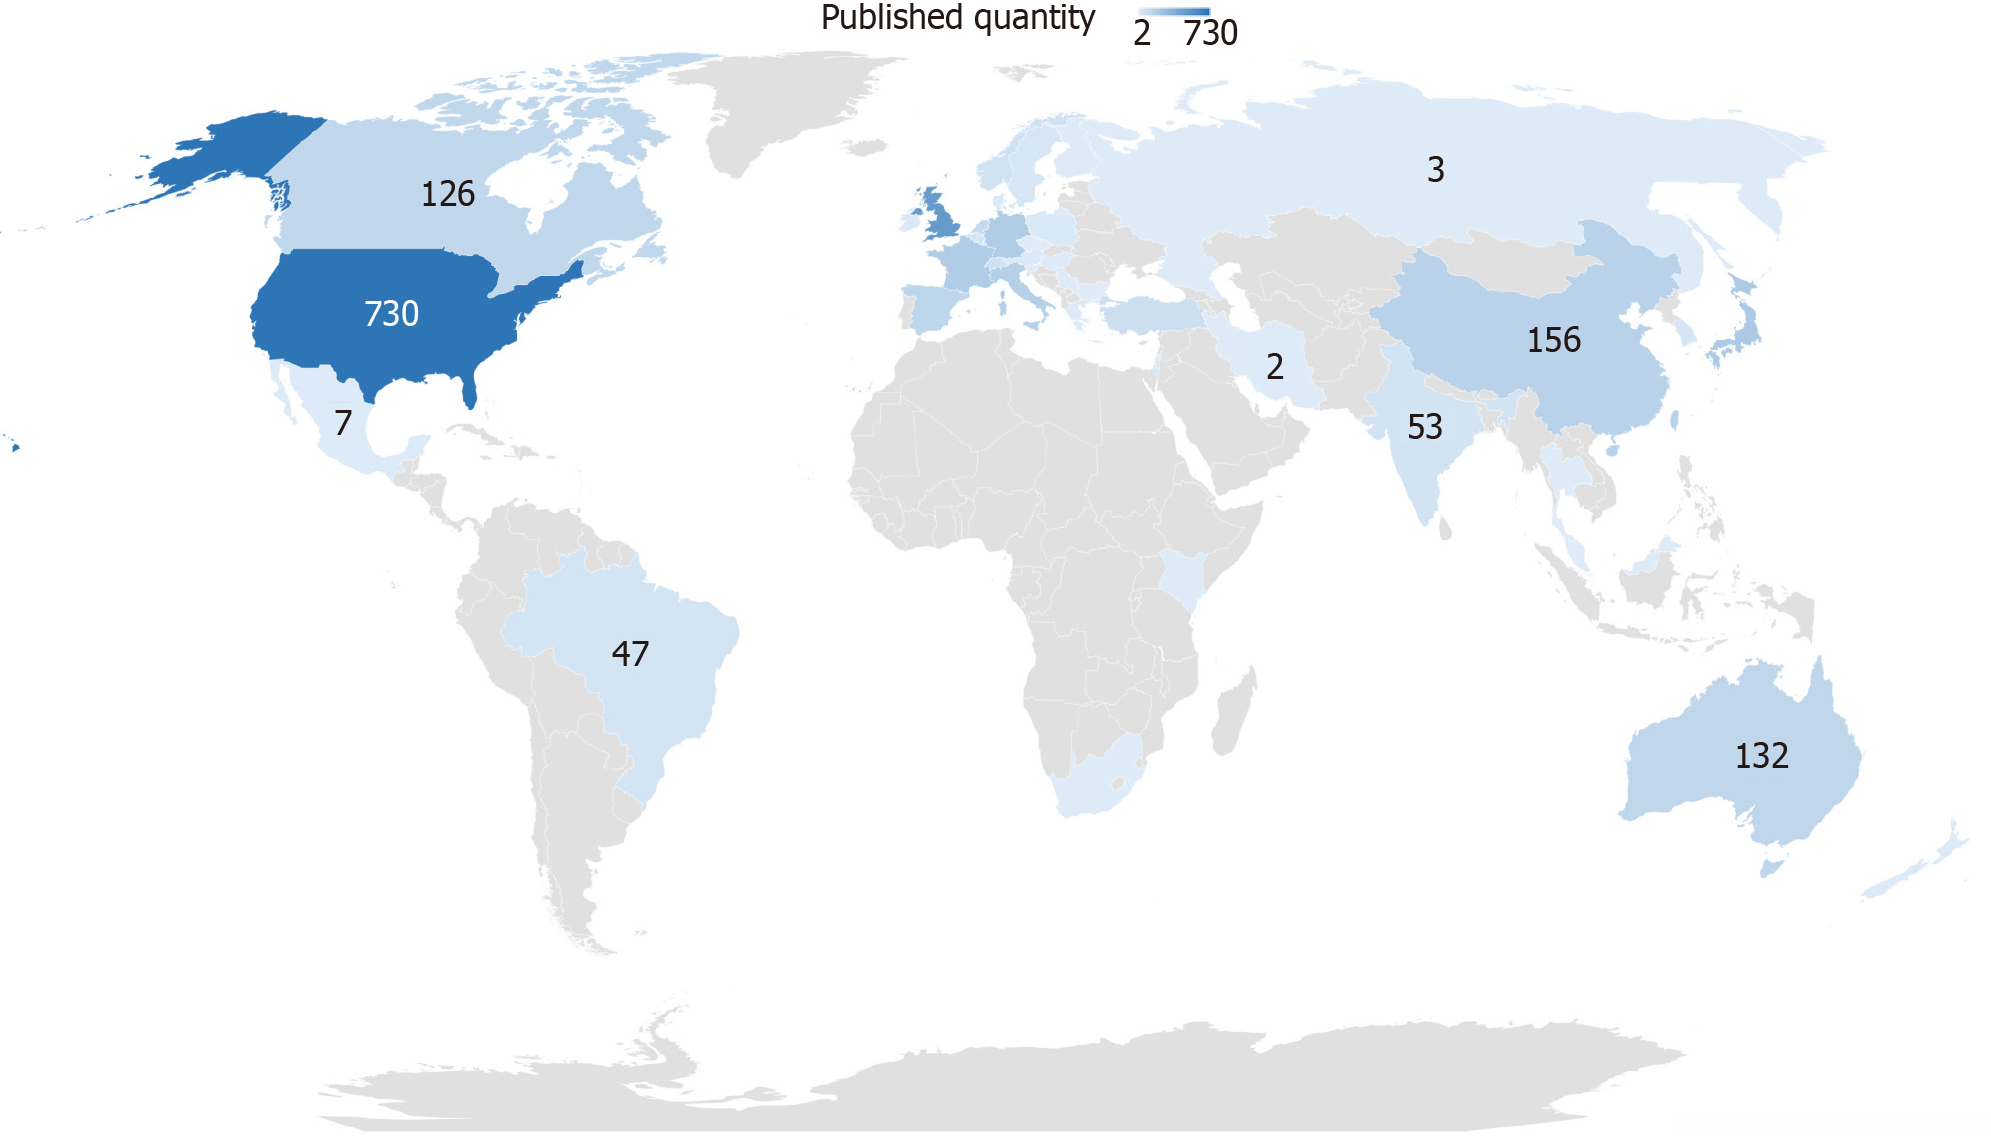
Figure 3 Geographic distribution of the countries.
The figures represent the corresponding country’s total published quantity on visual hallucination between 1999 and 2020. The larger the published quantity, the deeper the color.
- Citation: Zhong M, Wu Z, Jiang X, Shen B, Zhu J, Zhang L. Knowledge domain and emerging trends in visual hallucination research: A scientometric analysis. World J Psychiatr 2021; 11(8): 491-506
- URL: https://www.wjgnet.com/2220-3206/full/v11/i8/491.htm
- DOI: https://dx.doi.org/10.5498/wjp.v11.i8.491


