Copyright
©The Author(s) 2021.
World J Psychiatr. Jul 19, 2021; 11(7): 375-387
Published online Jul 19, 2021. doi: 10.5498/wjp.v11.i7.375
Published online Jul 19, 2021. doi: 10.5498/wjp.v11.i7.375
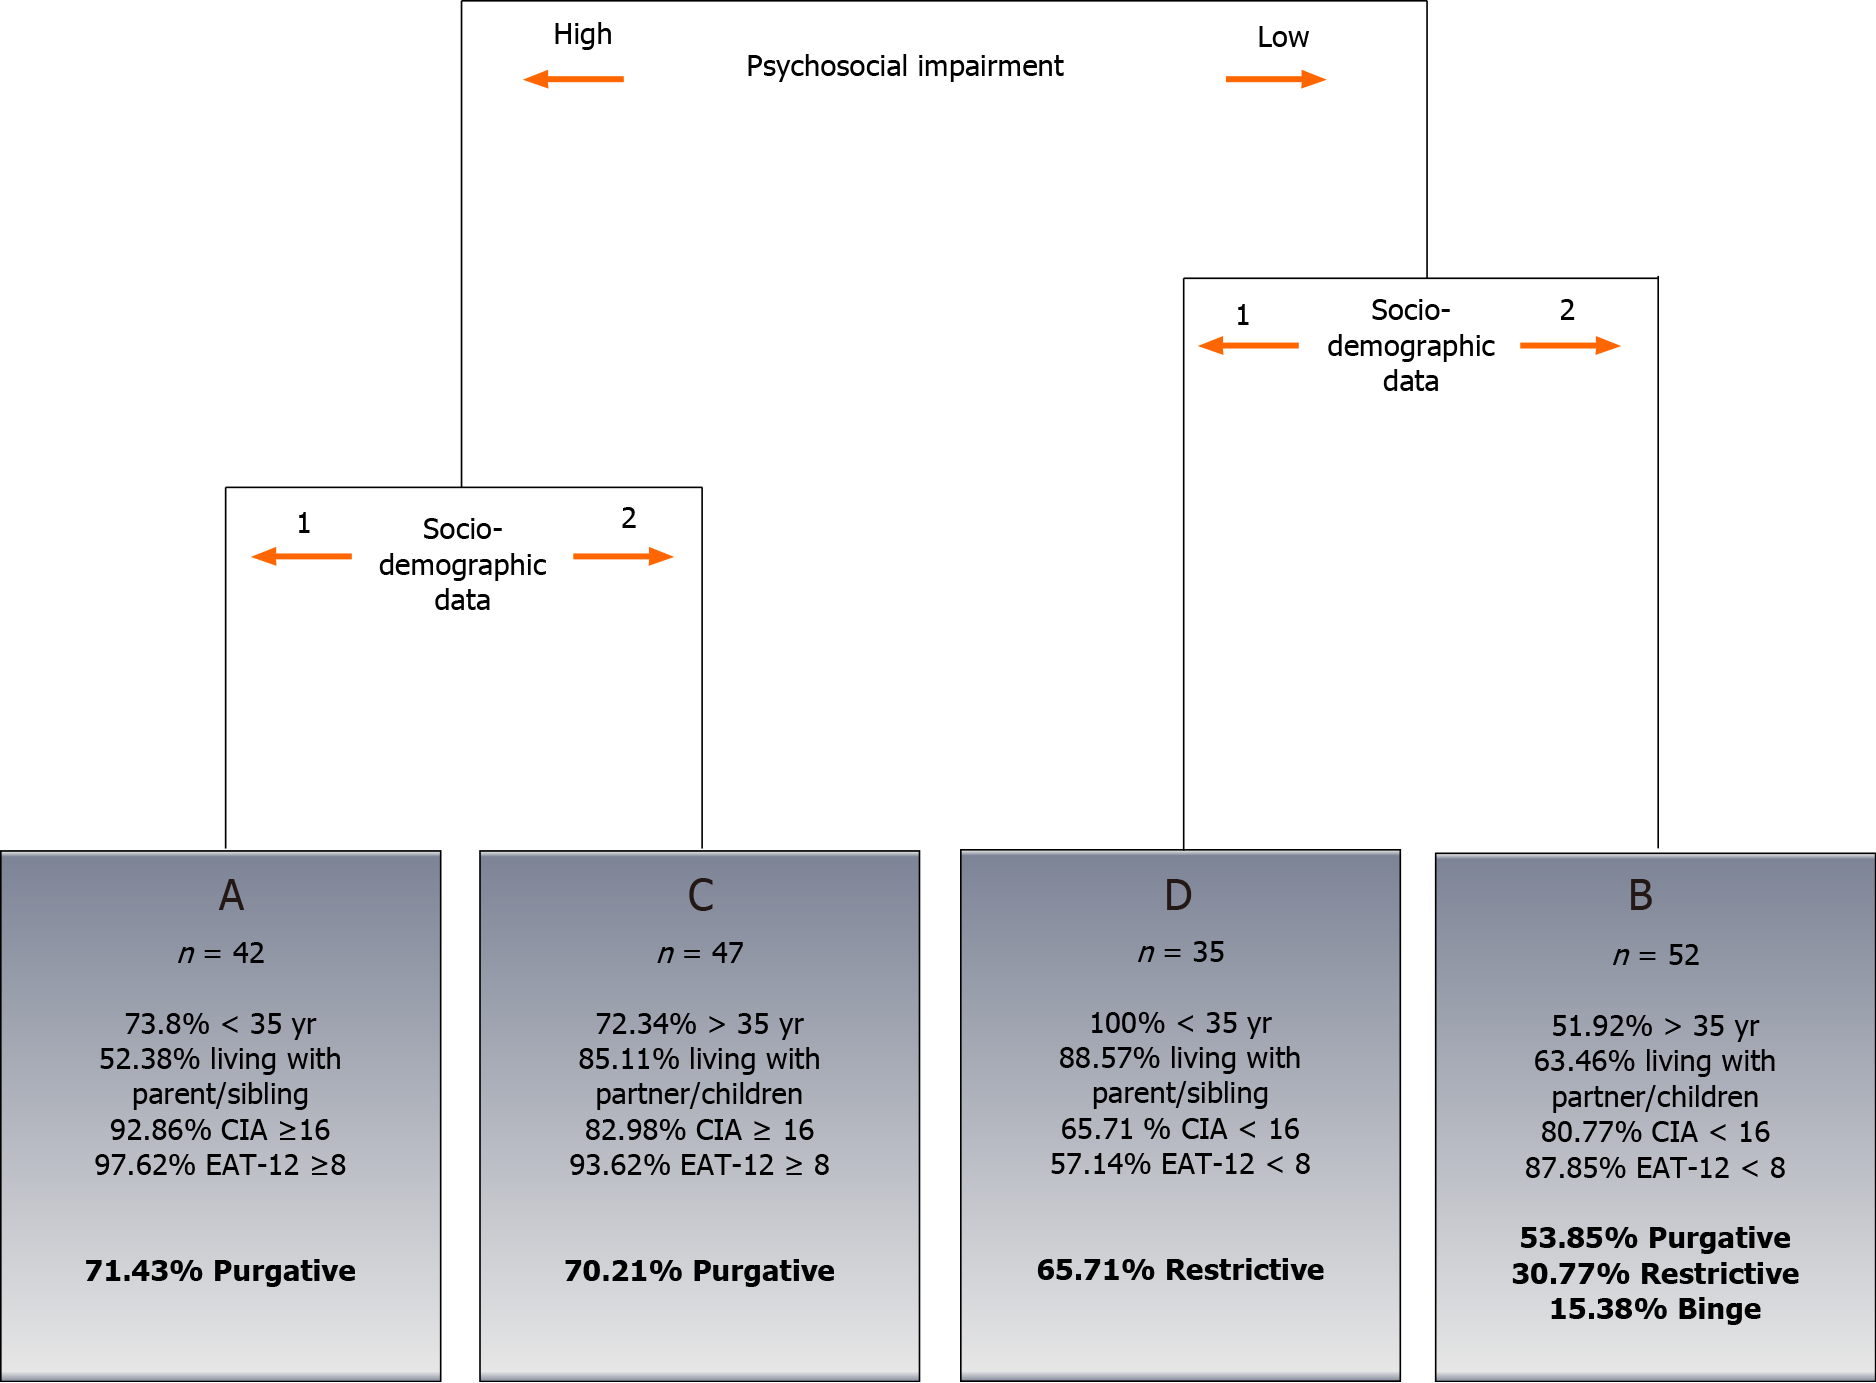
Figure 2 Dendogram obtained from the cluster analysis.
The dendogram represents the results from the cluster analysis performed with the two components obtained from the multiple correspondence analyses. The graphical display includes an easy interpretation of the clustering and a brief description of the identified groups. 1Having < 35 years, being single, having higher studies, being a student and living with friends or parents or/and a sibling; 2Having > 35 years, being male, having a spouse, having secondary studies, being a housewife and living with partner/children.CIA: Clinical impairment assessment; EAT: Eating attitudes test.
- Citation: Martín J, Anton-Ladislao A, Padierna Á, Berjano B, Quintana JM. Classification of subtypes of patients with eating disorders by correspondence analysis. World J Psychiatr 2021; 11(7): 375-387
- URL: https://www.wjgnet.com/2220-3206/full/v11/i7/375.htm
- DOI: https://dx.doi.org/10.5498/wjp.v11.i7.375


