Copyright
©The Author(s) 2020.
World J Psychiatr. Jan 19, 2020; 10(1): 1-11
Published online Jan 19, 2020. doi: 10.5498/wjp.v10.i1.1
Published online Jan 19, 2020. doi: 10.5498/wjp.v10.i1.1
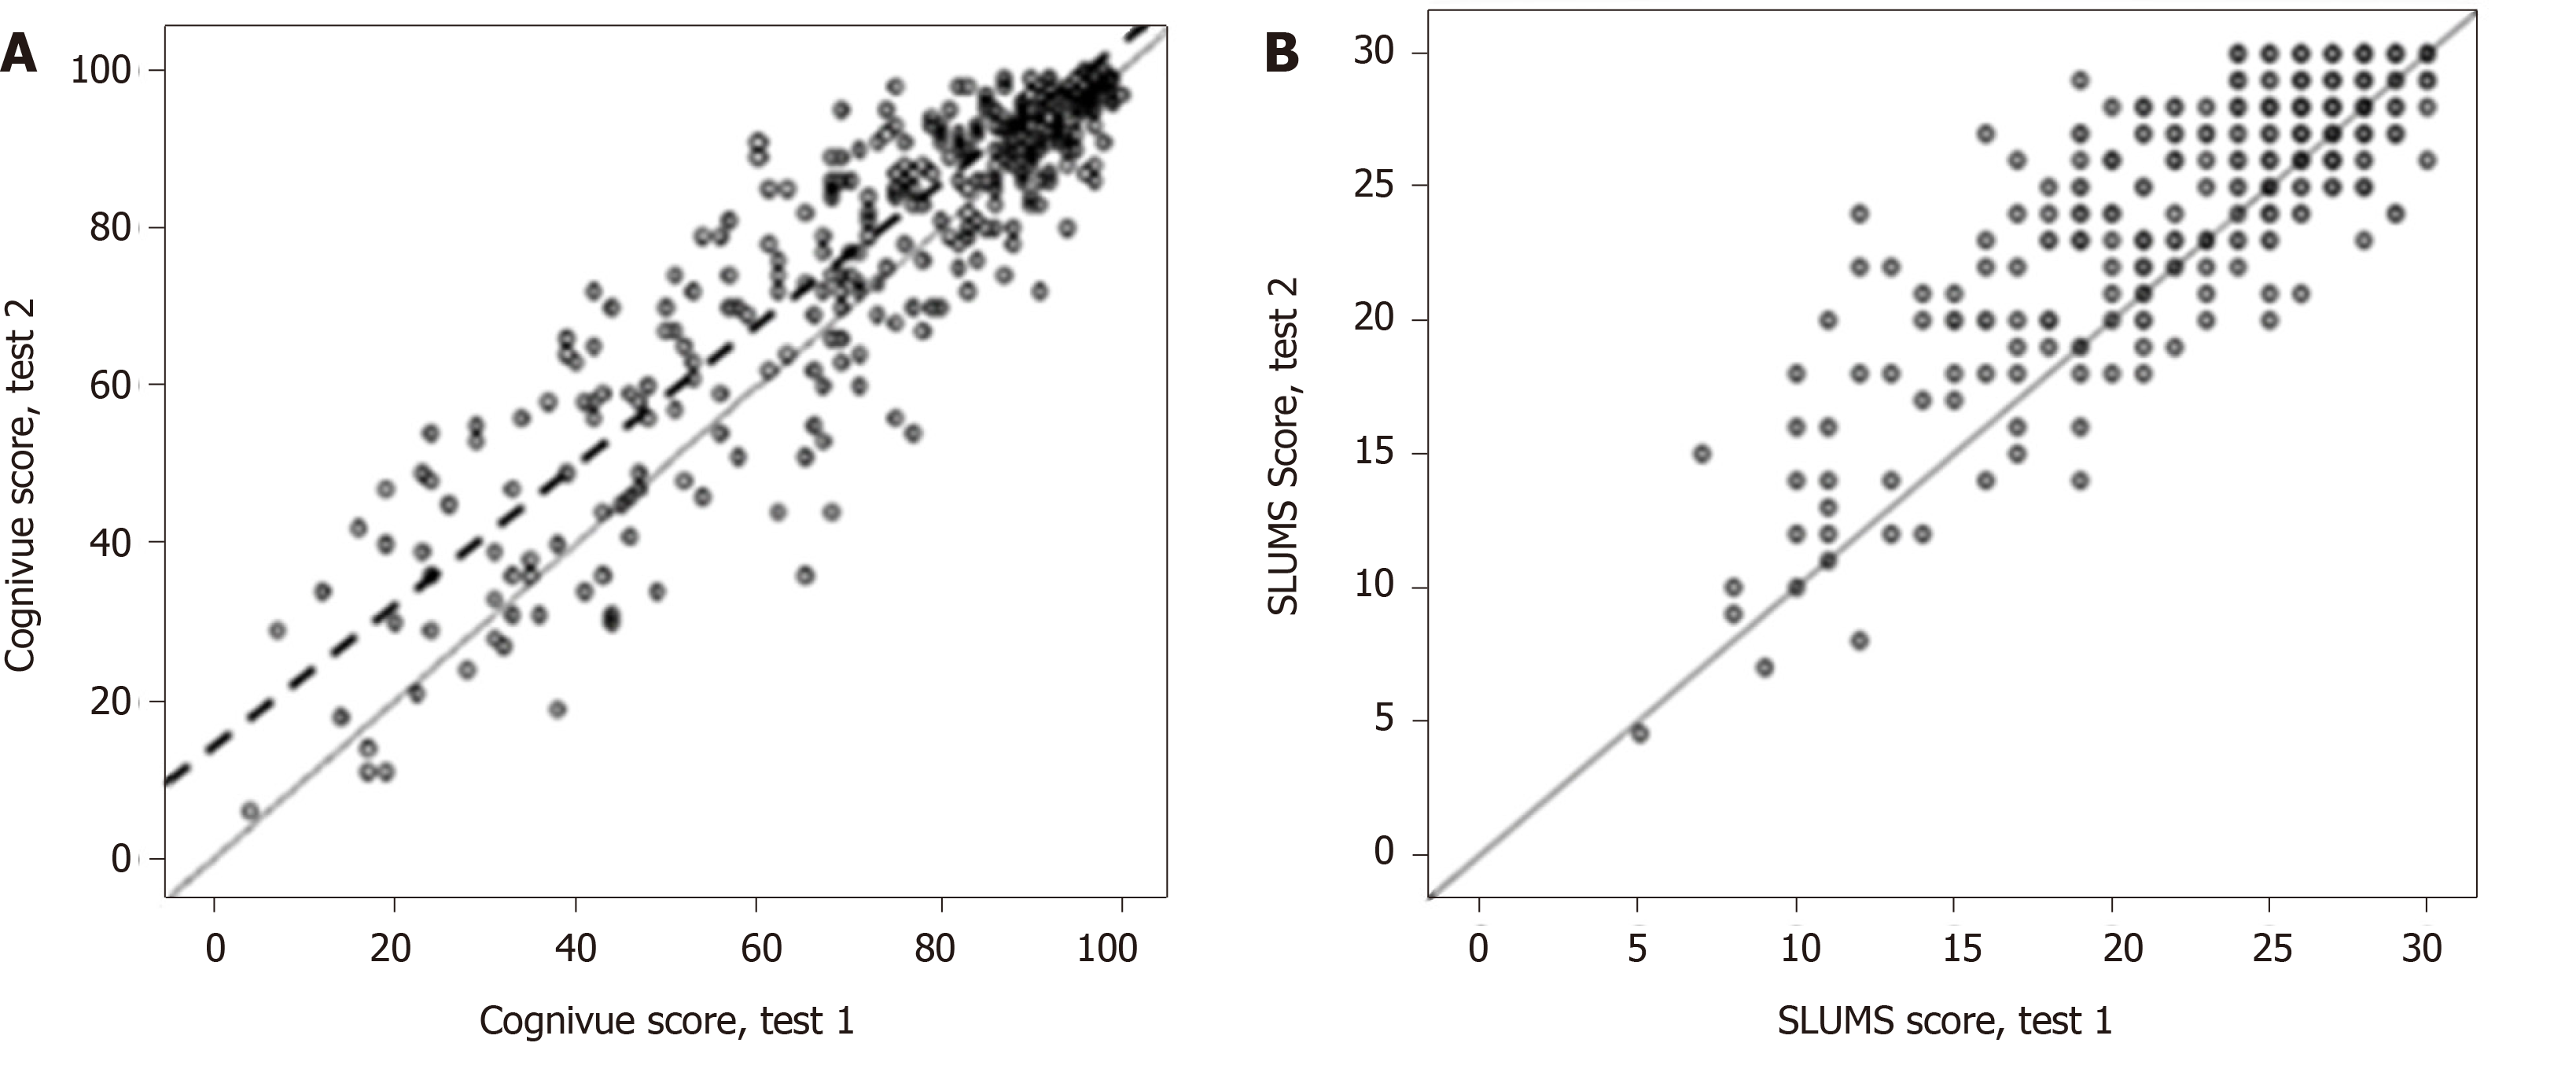
Figure 3 Scatterplot showing first test scores (abscissa) and second test scores (ordinate) co-plotted with a Deming regression line (dashed) and 45° line (solid) for Cognivue® and the St Louis University Mental Status.
A: Cognivue®; B: St. Louis University Mental Status. Cognivue®: Intercept of line: 95% confidence interval (CI): 4.27-13.84 (SE = 2.433; P = 0.0002); slope of line: 95%CI: 0.880-0.993 (SE = 0.0285; P = 0.0264); regression fit: R2 = 0.81 (r = 0.90). St. Louis University Mental Status: Intercept of line: 95%CI: 2.24-6.06 (SE = 0.970; P < 0.0001); slope of line: 95%CI: 0.82-0.97 (SE = 0.039; P = 0.039); regression fit: R2 = 0.67 (r = 0.82). SLUMS: St. Louis University Mental Status.
- Citation: Cahn-Hidalgo D, Estes PW, Benabou R. Validity, reliability, and psychometric properties of a computerized, cognitive assessment test (Cognivue®). World J Psychiatr 2020; 10(1): 1-11
- URL: https://www.wjgnet.com/2220-3206/full/v10/i1/1.htm
- DOI: https://dx.doi.org/10.5498/wjp.v10.i1.1


