Copyright
©The Author(s) 2020.
World J Psychiatr. Jan 19, 2020; 10(1): 1-11
Published online Jan 19, 2020. doi: 10.5498/wjp.v10.i1.1
Published online Jan 19, 2020. doi: 10.5498/wjp.v10.i1.1
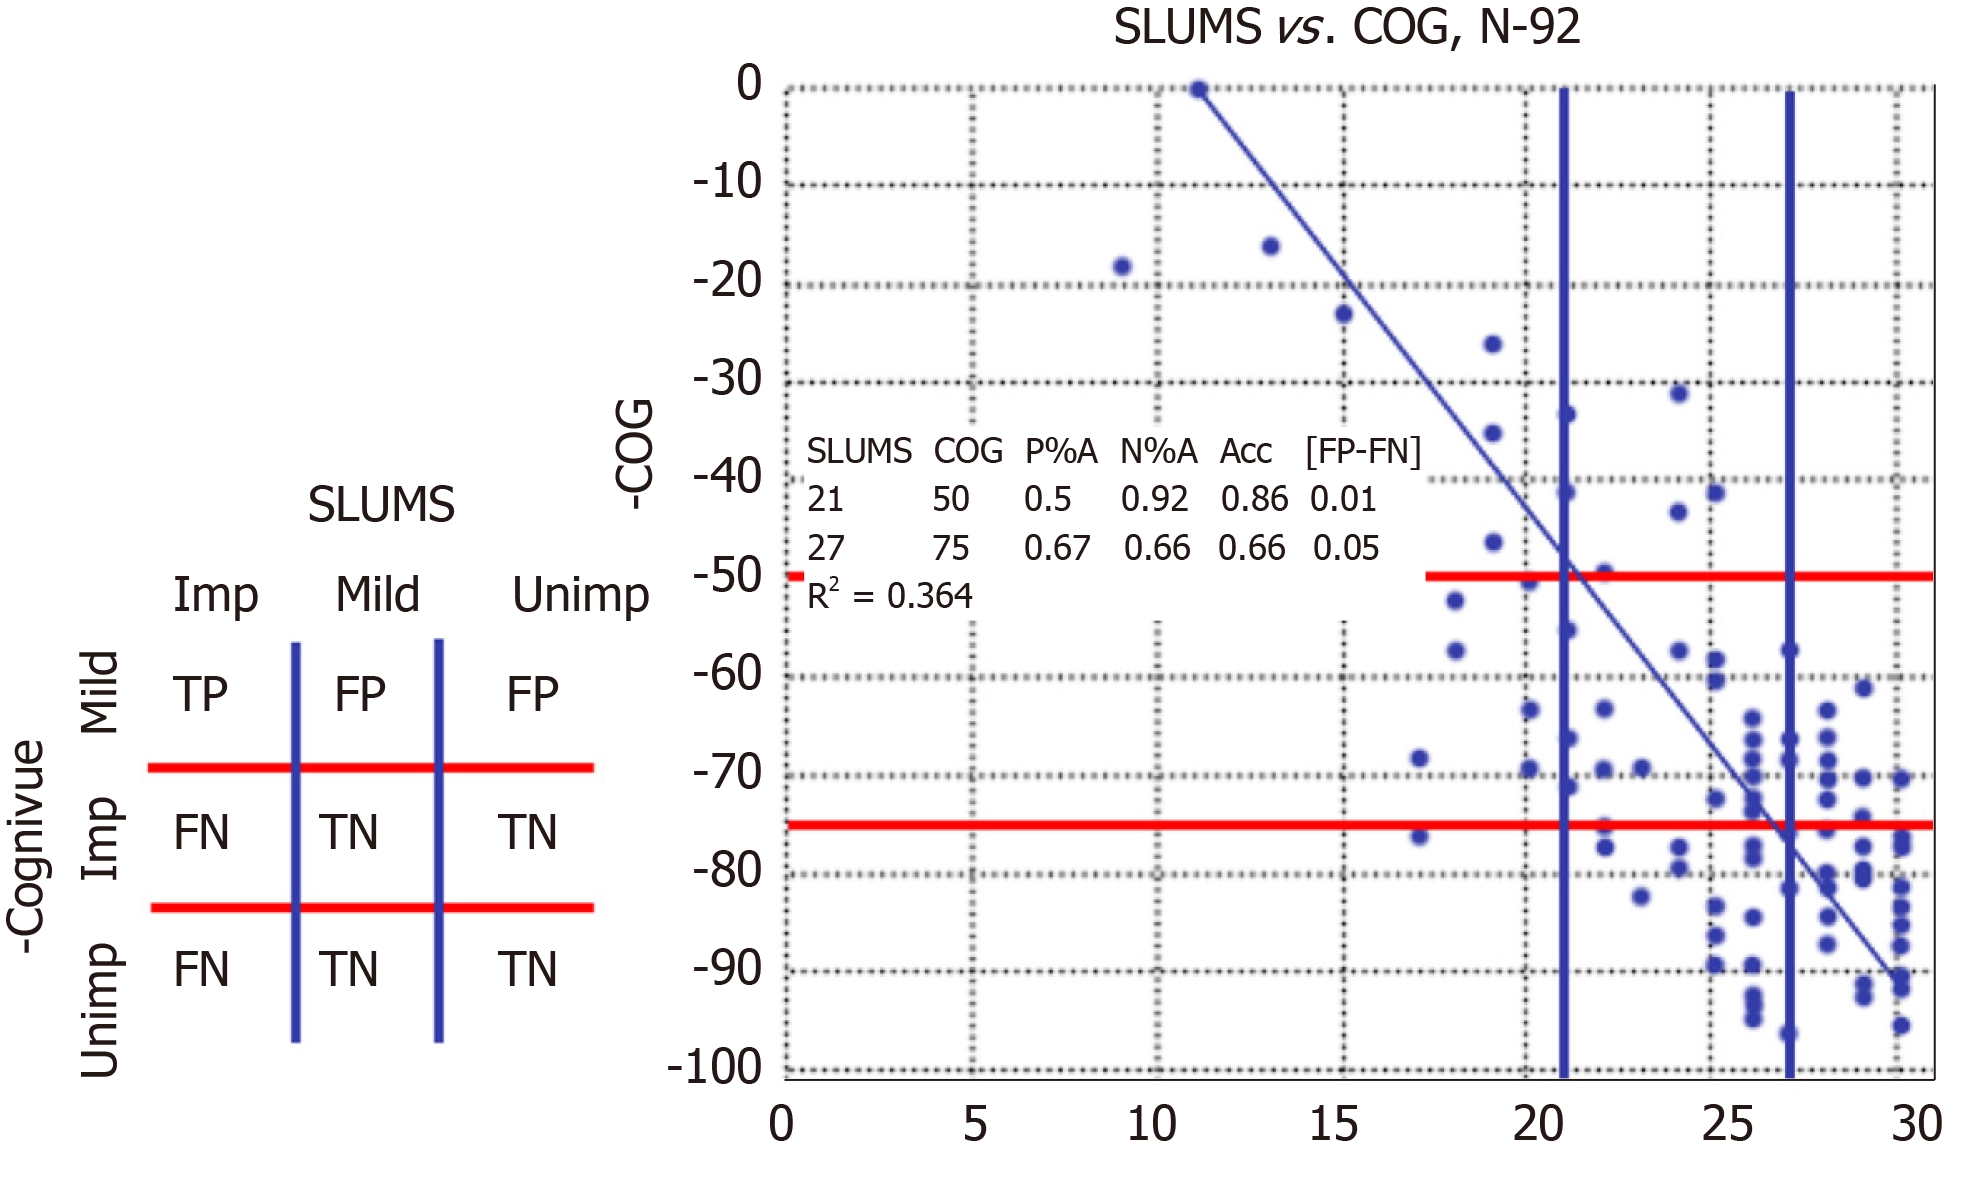
Figure 2 Scatterplot showing the St Louis University Mental Status and Cognivue® scores for the 92 study participants.
The table to the left of the scatter plot provides a key for relating the plot to participant classifications. Above the upper horizontal red line shows Cognivue® scores of < 50 and to the left of the left vertical blue line shows St. Louis University Mental Status (SLUMS) scores < 21 denoting impaired. Below the bottom horizontal red line shows Cognivue® scores of > 75 and to the right of the right vertical blue line shows SLUMS > 27 denoting unimpaired. Results of the analyses of classification are included in the table enclosed in the scatter plot. ACC: Accuracy; FN: False negative; FP: False positive; N%A: Negative percent agreement; P%A: Positive percent agreement; SLUMS: St. Louis University Mental Status; TN: True negative; TP: True positive.
- Citation: Cahn-Hidalgo D, Estes PW, Benabou R. Validity, reliability, and psychometric properties of a computerized, cognitive assessment test (Cognivue®). World J Psychiatr 2020; 10(1): 1-11
- URL: https://www.wjgnet.com/2220-3206/full/v10/i1/1.htm
- DOI: https://dx.doi.org/10.5498/wjp.v10.i1.1


