Copyright
©The Author(s) 2024.
World J Psychiatry. Feb 19, 2024; 14(2): 255-265
Published online Feb 19, 2024. doi: 10.5498/wjp.v14.i2.255
Published online Feb 19, 2024. doi: 10.5498/wjp.v14.i2.255
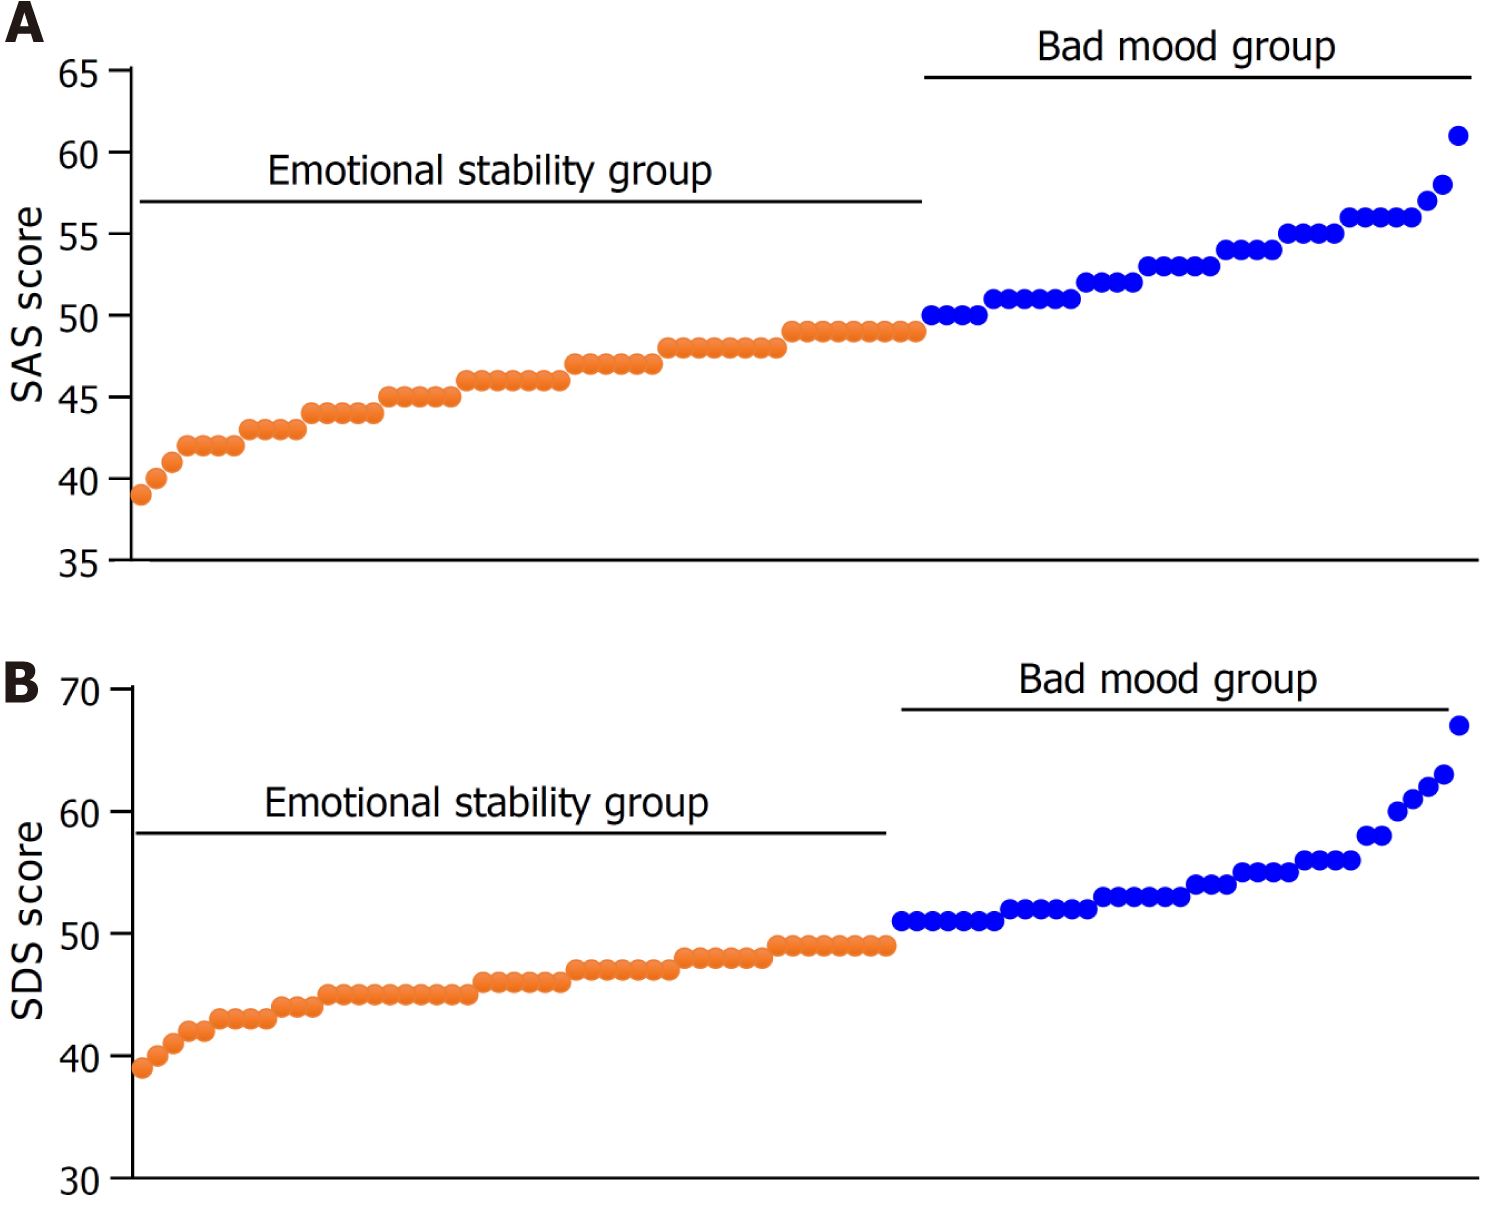
Figure 1 Assessment of patients' bad mood.
A: Self-Rating Anxiety Scale scores of patients in training group; B: Self-Rating Depression Scale scores of patients in training group. SAS: Self-Rating Anxiety Scale; SDS: Self-Rating Depression Scale.
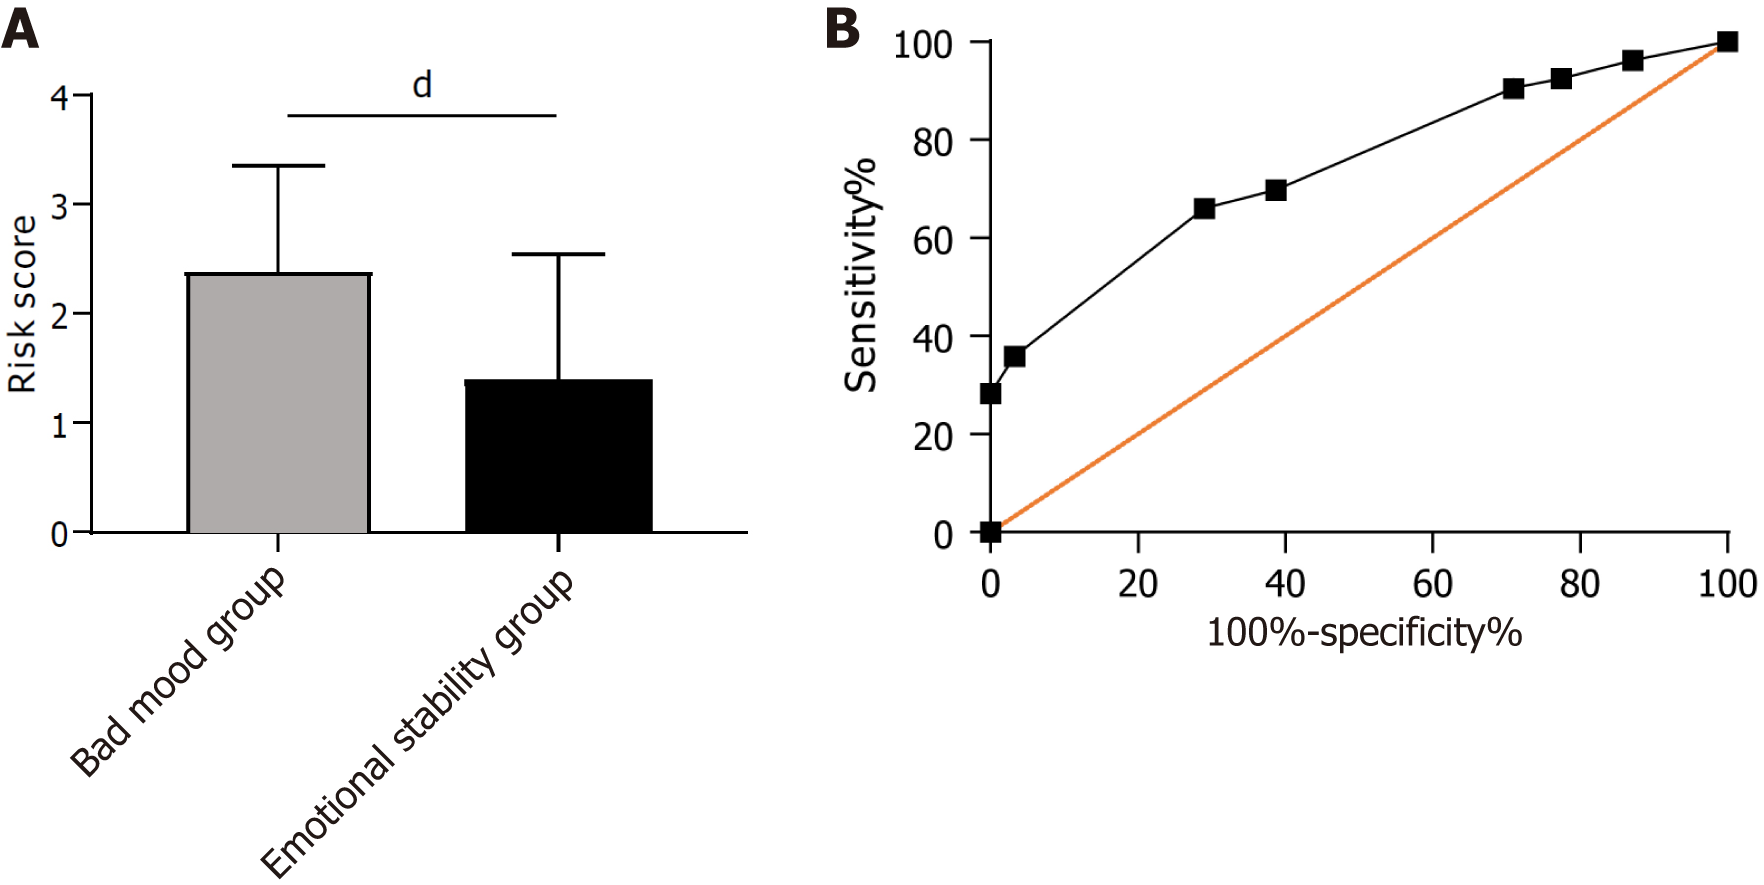
Figure 2 Construction of a risk prediction model for bad mood in patients in the training group.
A: The risk score of patients with bad mood in the training group; B: The area under the curve of the risk score in predicting bad mood in patients with bad mood in the training group. dP < 0.0001.
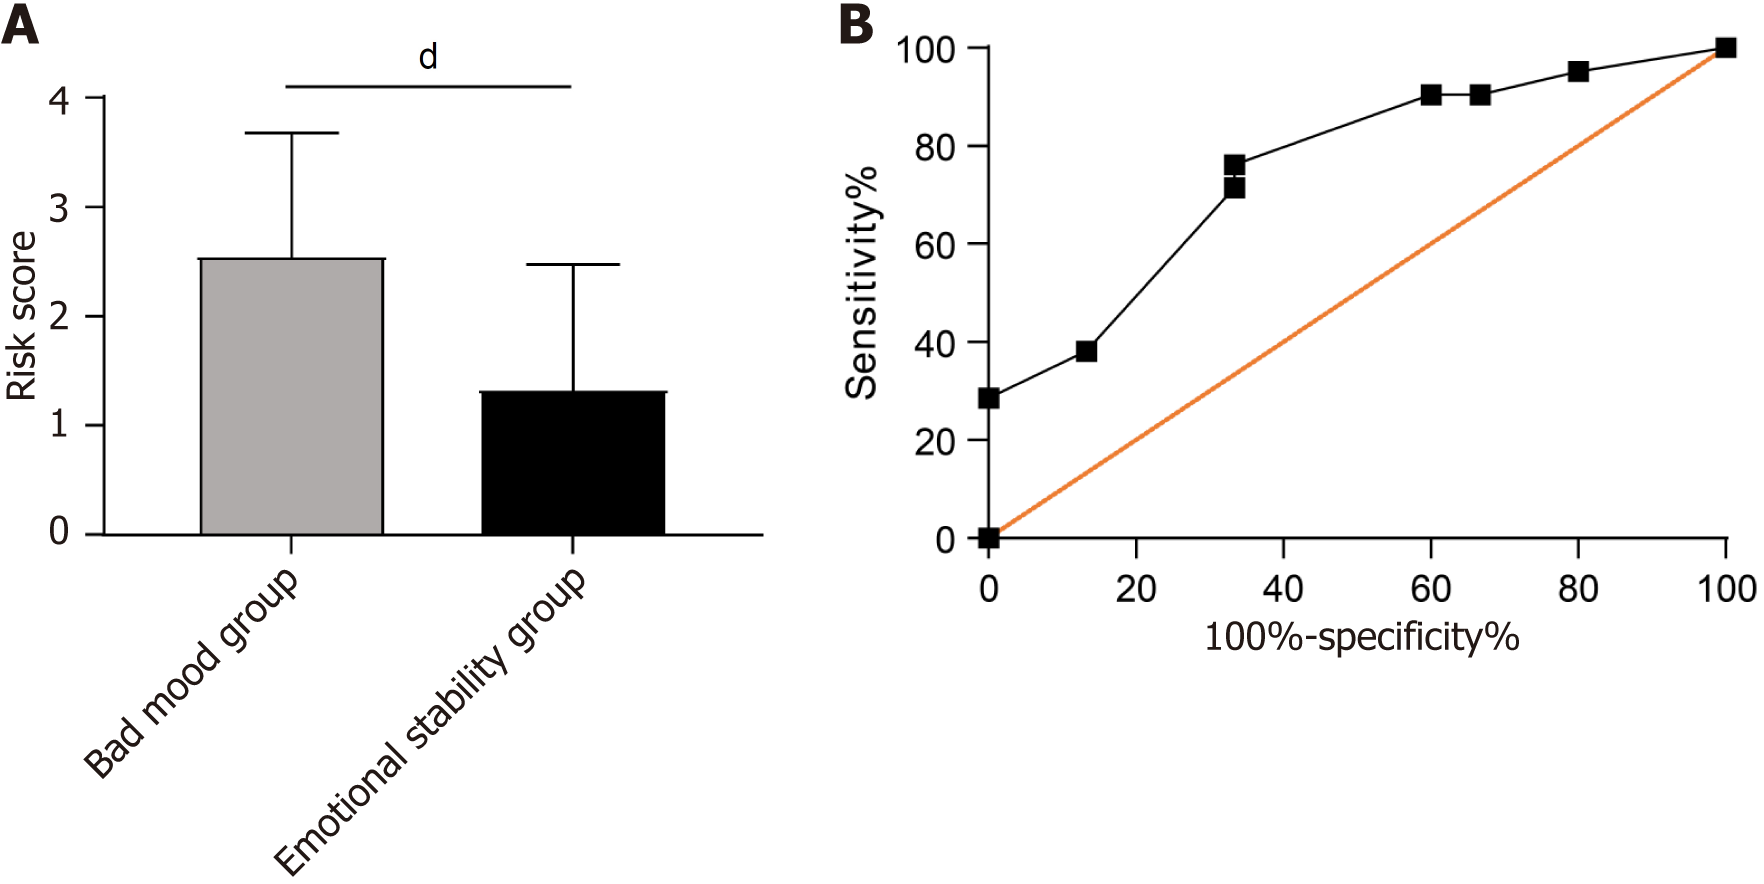
Figure 3 Risk prediction model construction for bad mood in patients in the validation group.
A: The risk score in patients with bad mood in the validation group; B: The area under the curve of risk score in predicting bad mood in patients with bad mood in the validation group. dP < 0.0001.
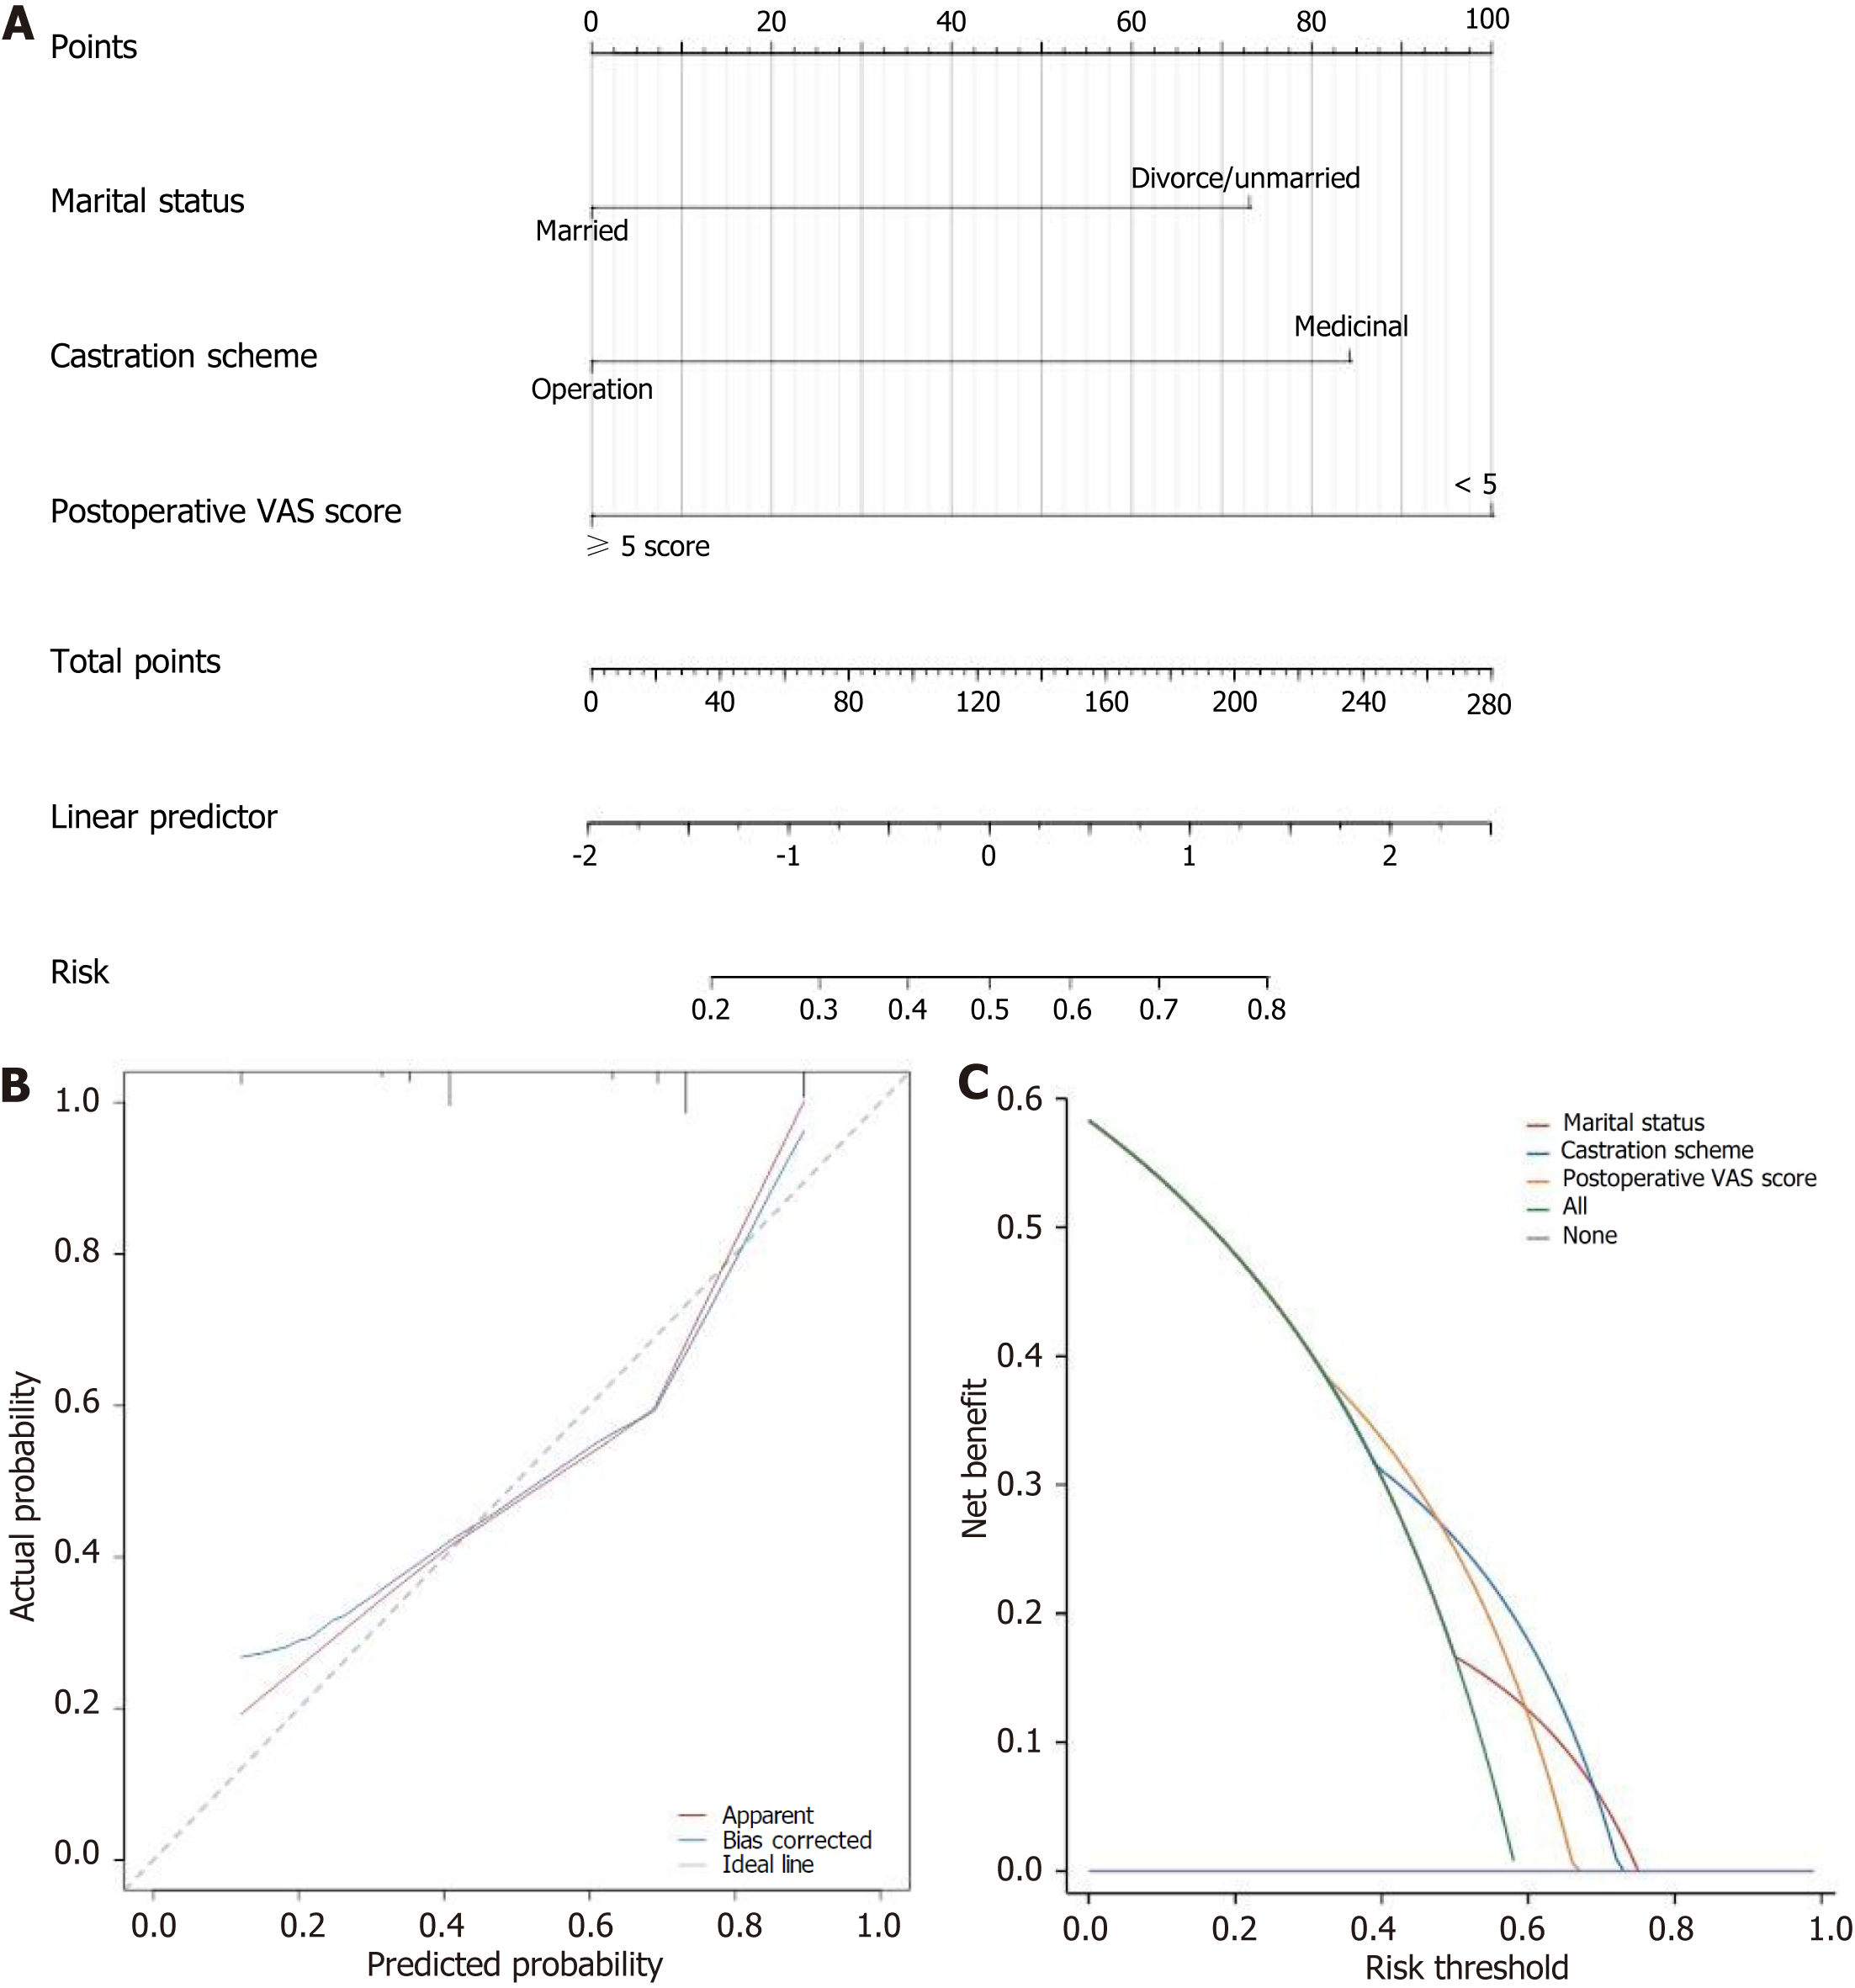
Figure 4 Construction and validation of the nomogram.
A: A nomogram of bad mood in prostate cancer patients; B: Calibration curve of bad mood in prostate cancer patients; C: Decision curve of bad mood in prostate cancer patients. VAS: Visual Analogue Scale.
- Citation: Li RX, Li XL, Wu GJ, Lei YH, Li XS, Li B, Ni JX. Analysis of risk factors leading to anxiety and depression in patients with prostate cancer after castration and the construction of a risk prediction model. World J Psychiatry 2024; 14(2): 255-265
- URL: https://www.wjgnet.com/2220-3206/full/v14/i2/255.htm
- DOI: https://dx.doi.org/10.5498/wjp.v14.i2.255


