Copyright
©The Author(s) 2015.
World J Exp Med. May 20, 2015; 5(2): 140-153
Published online May 20, 2015. doi: 10.5493/wjem.v5.i2.140
Published online May 20, 2015. doi: 10.5493/wjem.v5.i2.140
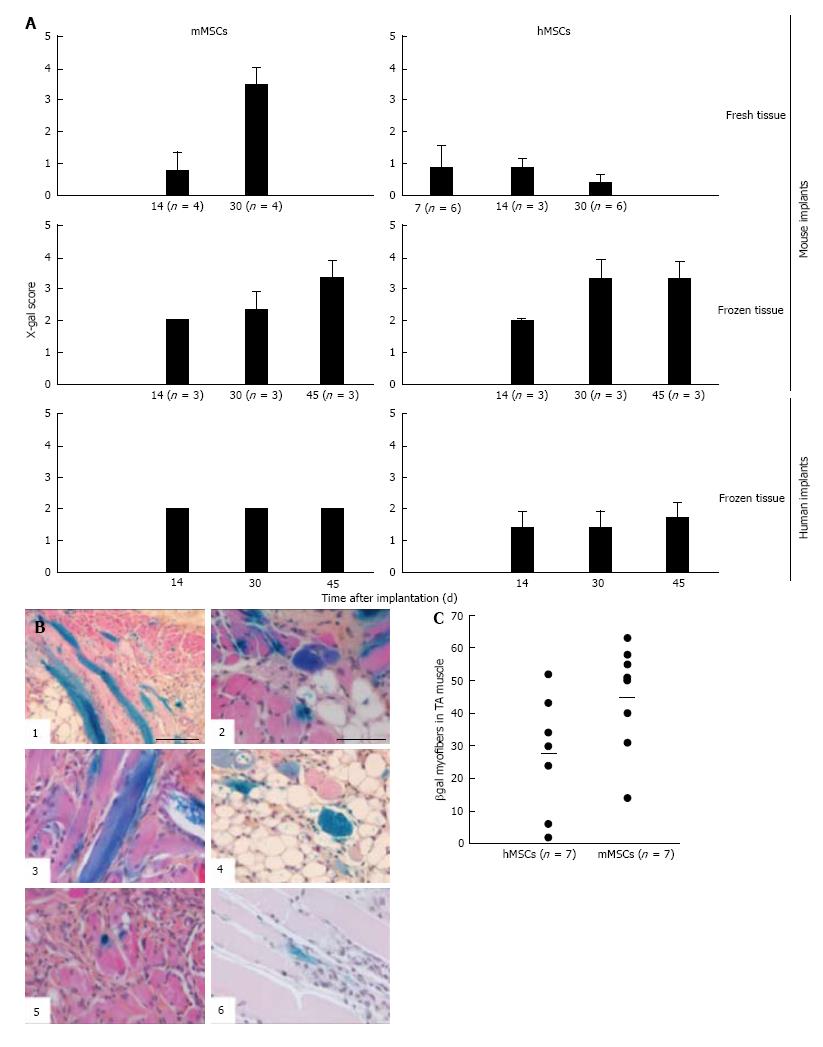
Figure 7 Contribution of mouse mesenchymal stem cells and human mesenchymal stem cells to myoregeneration in implants of fresh and cryopreserved mouse and human muscle minced.
MSCs and their derivatives were identified by X-gal staining. A: For comparing implants we used an arbitrary score described in Results. Plotted in A is the average X-gal score and SD. Numbers in parentheses indicate number of implants analyzed; B: Representative images of X-gal-stained sections of fresh mouse muscle implants at 30 d after grafting. Note the higher frequency of blue myofibers (longitudinal and transversal cuts) and β-gal+ mononuclear cells in the implants containing mMSCs (B1-4) as compared to those with hMSCs (B5 and 6). Scale bar is 100 μm for B1 and 50 μm for B2 through B6; C: Quantification of β-gal+ myofibers in CTX-damaged tibialis anterior (TA) muscles of NOD/SCID mice following injection of LacZ-tagged MSCs. Each mouse received 5 × 10⁵ cells. Muscles were collected 30 d after stem cell injection and processed as described in[2]. Data points represent numbers of hybrid myofibers per TA. The average number of hybrid myofibers for hMSCs and mMSCs was 27 ± 18.3 and 45 ± 16.2, respectively. MSCs: Mesenchymal stem cells; hMSCs: Human mesenchymal stem cells; mMSCs: Mouse mesenchymal stem cells.
- Citation: Garza-Rodea ASL, Boersma H, Dambrot C, Vries AA, Bekkum DWV, Knaän-Shanzer S. Barriers in contribution of human mesenchymal stem cells to murine muscle regeneration. World J Exp Med 2015; 5(2): 140-153
- URL: https://www.wjgnet.com/2220-315X/full/v5/i2/140.htm
- DOI: https://dx.doi.org/10.5493/wjem.v5.i2.140


