Copyright
©The Author(s) 2016.
World J Crit Care Med. Feb 4, 2016; 5(1): 74-82
Published online Feb 4, 2016. doi: 10.5492/wjccm.v5.i1.74
Published online Feb 4, 2016. doi: 10.5492/wjccm.v5.i1.74
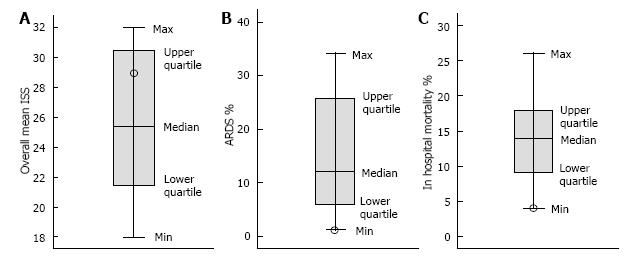
Figure 4 Boxplots for mean individual severity score (A), acute respiratory distress syndrome % (B), and in-hospital mortality % (C).
Mean ISS shows the range and distribution of ISS scores reported by 16 authors; 50% of them reported ISS between 30.5 and 23.2, with the middle score of 25.4 (median). The mean ISS of 29 for the preemptive APRV group belonged to the upper quartile of the boxplot. ARDS incidence % shows the range and distribution of scores reported by 16 authors; 50% of them reported ARDS incidence between 22.5% and 6%, with the middle score of 11.95% (median). The incidence of ARDS in the preemptive APRV group represented the minimum score at 1.3%. Mortality % shows the range and distribution of mortality scores reported by 16 authors; 50% of them reported mortality between 18.2% and 9.2%, with the middle score of 13.9% (median). The preemptive APRV group scored the minimum mortality rate of 3.9%. Republished with permission from Ref[11]. ARDS: Acute respiratory distress syndrome; APRV: Airway pressure release ventilation; ISS: Individual severity score.
- Citation: Sadowitz B, Jain S, Kollisch-Singule M, Satalin J, Andrews P, Habashi N, Gatto LA, Nieman G. Preemptive mechanical ventilation can block progressive acute lung injury. World J Crit Care Med 2016; 5(1): 74-82
- URL: https://www.wjgnet.com/2220-3141/full/v5/i1/74.htm
- DOI: https://dx.doi.org/10.5492/wjccm.v5.i1.74


