Copyright
©The Author(s) 2016.
World J Crit Care Med. Feb 4, 2016; 5(1): 74-82
Published online Feb 4, 2016. doi: 10.5492/wjccm.v5.i1.74
Published online Feb 4, 2016. doi: 10.5492/wjccm.v5.i1.74
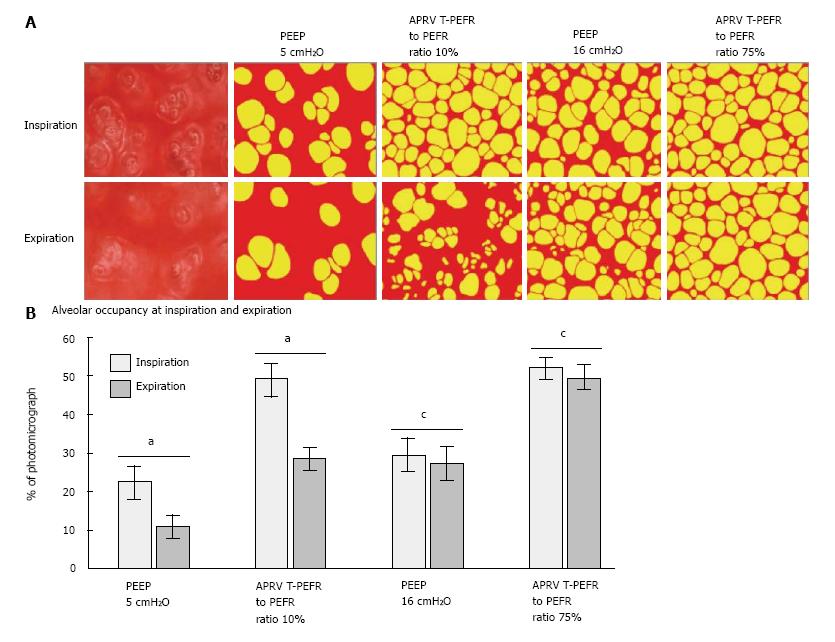
Figure 3 In vivo photomicrographs and percentage of alveolar air space occupancy at inspiration and expiration.
A: In vivo photomicrographs at inspiration and expiration prior to coloring and for positive end-expiratory pressure (PEEP) of 5 cm H2O, airway pressure release ventilation (APRV) ratio of termination of peak expiratory flow rate (T-PEFR) to peak expiratory flow rate (PEFR) of 10%, PEEP of 16 cm H2O, and APRV T-PEFR to PEFR ratio of 75% (original magnification × 10). Alveoli are colored in yellow; nonalveolar tissue, red; B: Alveolar air space occupancy is expressed as a percentage of the photomicrograph containing inflated alveoli (yellow in A) at inspiration and expiration. Data are shown as the mean; error bars indicate standard error of the mean. aP < 0.05 for PEEP of 5 cmH2O vs APRVT-PEFR to PEFR ratio of 10%; cP < 0.05 for PEEP of 16 cmH2O vs APRV T-PEFR to PEFR ratio of 75%. Republished with permission from Ref[40].
- Citation: Sadowitz B, Jain S, Kollisch-Singule M, Satalin J, Andrews P, Habashi N, Gatto LA, Nieman G. Preemptive mechanical ventilation can block progressive acute lung injury. World J Crit Care Med 2016; 5(1): 74-82
- URL: https://www.wjgnet.com/2220-3141/full/v5/i1/74.htm
- DOI: https://dx.doi.org/10.5492/wjccm.v5.i1.74


