Copyright
©The Author(s) 2015.
World J Crit Care Med. Feb 4, 2015; 4(1): 62-70
Published online Feb 4, 2015. doi: 10.5492/wjccm.v4.i1.62
Published online Feb 4, 2015. doi: 10.5492/wjccm.v4.i1.62
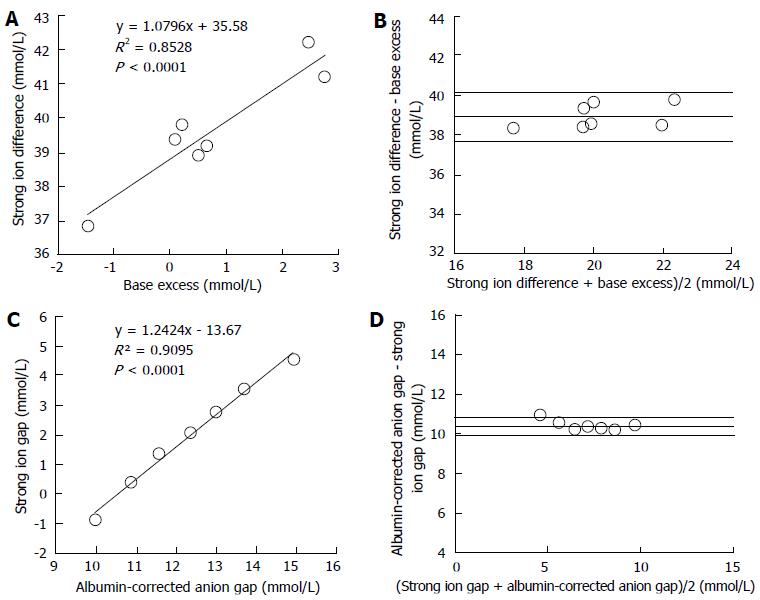
Figure 3 Regression and Bland and Altman analysis between metabolic parameters of different approaches in seven normal volunteers.
A: Lineal regression between base excess and strong ion difference; B: Agreement between base excess and strong ion difference; C: Lineal regression between albumin-corrected anion gap and strong ion gap; D: Agreement between albumin-corrected anion gap and strong ion gap; Panel B and D display the relationship between the mean value and the difference of both measurements. The lines indicate the mean difference between both parameters (bias) ± 2 SD (95% limits of agreement). Modified from Dubin et al[37].
- Citation: Masevicius FD, Dubin A. Has Stewart approach improved our ability to diagnose acid-base disorders in critically ill patients? World J Crit Care Med 2015; 4(1): 62-70
- URL: https://www.wjgnet.com/2220-3141/full/v4/i1/62.htm
- DOI: https://dx.doi.org/10.5492/wjccm.v4.i1.62


