Copyright
©The Author(s) 2017.
World J Clin Urol. Mar 24, 2017; 6(1): 18-26
Published online Mar 24, 2017. doi: 10.5410/wjcu.v6.i1.18
Published online Mar 24, 2017. doi: 10.5410/wjcu.v6.i1.18
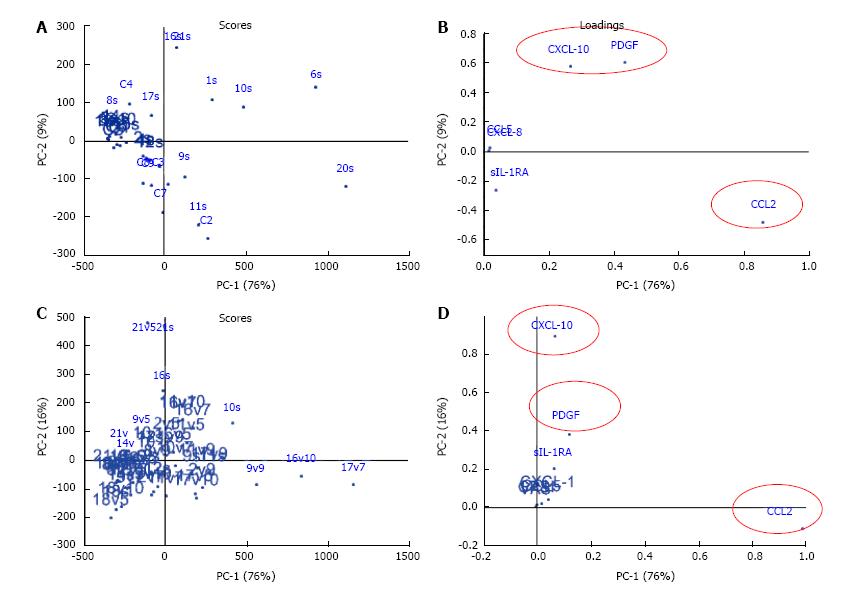
Figure 2 Visualization of principal component analysis for the cross sectional data of asymptomatic controls (C1-10) and chronic prostatitis/chronic pelvic pain syndrome patients (1 s-21 s).
At baseline (A and B) and the longitudinal treatment response data of adherent and non-adherent CP/CPPS patients (C and D), PC1 and PC2 explained 76 % and 9% of the data characteristics at baseline (A and B), respectively which in turn was explained largely by the variation in the urine levels of CCL2, CXCL-10 and PDGF. Majority of CP/CPPS mapped separately from a close cluster for controls (A), and the scatter of CP/CPPS is explained by disease heterogeneity as revealed by the variation in the levels of different chemokines in CP/CPPS at baseline (Figure 1). PCA of longitudinal data also included VAS and CPSI scores measured at each visit as variables, where each dot represents the expression profile of an individual patient at a singular timepoint identified by baseline (s), visit 5 (v5), visit7 (v7), visit 9 (v9), and final visit (v10) (C). PCA allowed grouping of patients with overall similar cytokine expression profiles at individual time points. Compared to PCA of cross-sectional data (A and B), the contribution of CCL2 was slightly increased whereas contribution of CXCL-10 was slightly reduced in PC1 of longitudinal data (Panel D). The urine levels of CXCL-1 and CCL5 together with CPSI scores only contributed < 1% to both PC1 and PC2 scores. PC: Principal components; PDGF: Platelet derived growth factor.
- Citation: Tyagi P, Killinger K, McLennan G, Jayabalan N, Chancellor M, Peters KM. Urine chemokine levels correlate with treatment response to phosphodiesterase 4 inhibitor in prostatitis. World J Clin Urol 2017; 6(1): 18-26
- URL: https://www.wjgnet.com/2219-2816/full/v6/i1/18.htm
- DOI: https://dx.doi.org/10.5410/wjcu.v6.i1.18


