Copyright
©The Author(s) 2016.
World J Clin Urol. Mar 24, 2016; 5(1): 29-36
Published online Mar 24, 2016. doi: 10.5410/wjcu.v5.i1.29
Published online Mar 24, 2016. doi: 10.5410/wjcu.v5.i1.29
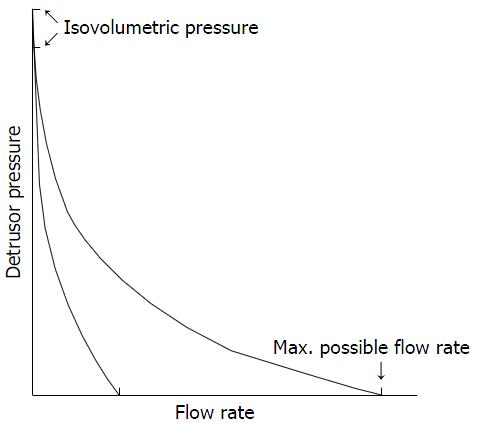
Figure 2 Bladder output relations relating active detrusor pressure to rate of urine flow at a given bladder volume.
Curves show Bladder output relations for the same two situations as in Figure 1, corresponding to a full bladder (curve with higher maximum possible flow rate) and a nearly empty bladder (lower maximum possible flow rate; volume approximately 12.5% of capacity). (From Griffiths[8]. Assessment of detrusor contraction strength or contractility. Neurourol Urodyn 1991; 10: 1; with permission).
- Citation: Valdevenito JP, Walton-Diaz A. Diagnosis of voiding dysfunction by pressure-flow study in women. World J Clin Urol 2016; 5(1): 29-36
- URL: https://www.wjgnet.com/2219-2816/full/v5/i1/29.htm
- DOI: https://dx.doi.org/10.5410/wjcu.v5.i1.29


