Copyright
©The Author(s) 2019.
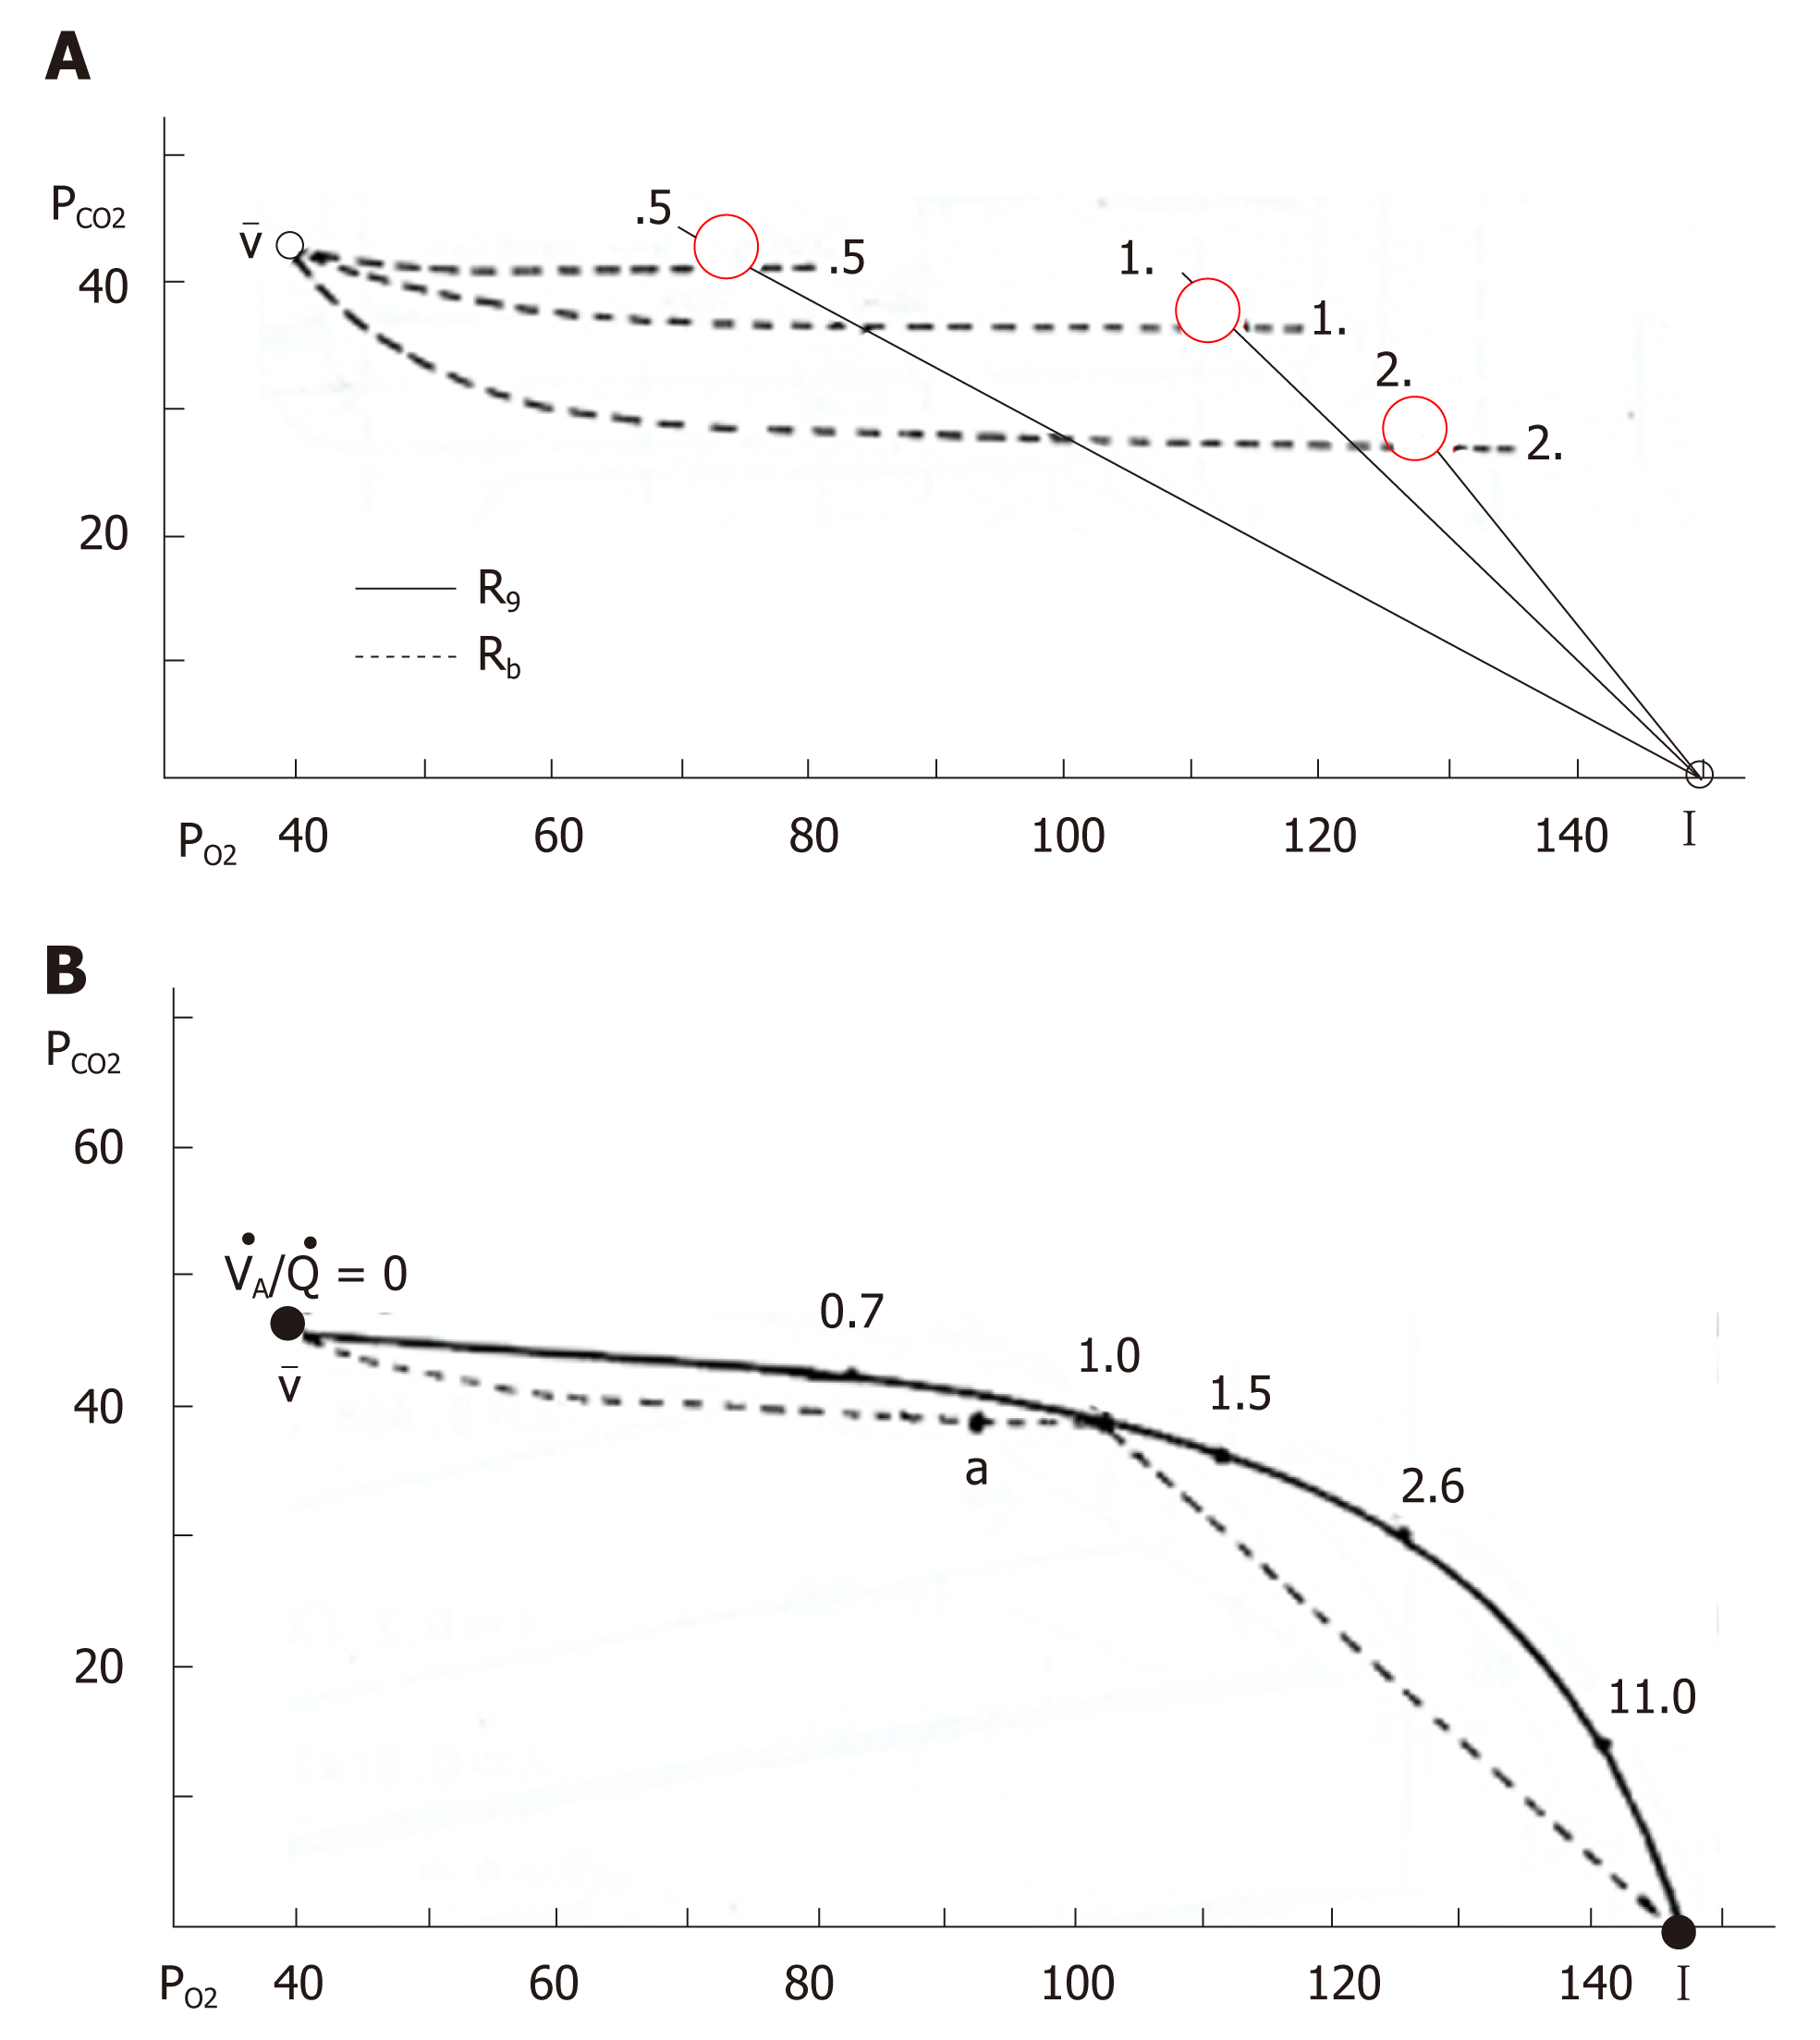
Figure 9 O2-CO2 diagram and ventilation-perfusion line.
A: O2-CO2 diagram, in which solid and dotted lines indicate gas R lines and blood R lines, respectively. Intersection of these two lines denoted by red circle provides a single ventilation-perfusion value and corresponding unique pair of PO2 and PCO2; B: Ventilation-perfusion line constructed by connecting each intersection of gas R lines and blood R lines. I: Inspired point; a: Arterial point; v: Mixed venous point. See text for further explanation. Adopted from ref[87].
- Citation: Yamaguchi K, Tsuji T, Aoshiba K, Nakamura H, Abe S. Anatomical backgrounds on gas exchange parameters in the lung. World J Respirol 2019; 9(2): 8-29
- URL: https://www.wjgnet.com/2218-6255/full/v9/i2/8.htm
- DOI: https://dx.doi.org/10.5320/wjr.v9.i2.8


