Copyright
©The Author(s) 2015.
World J Respirol. Nov 28, 2015; 5(3): 188-198
Published online Nov 28, 2015. doi: 10.5320/wjr.v5.i3.188
Published online Nov 28, 2015. doi: 10.5320/wjr.v5.i3.188
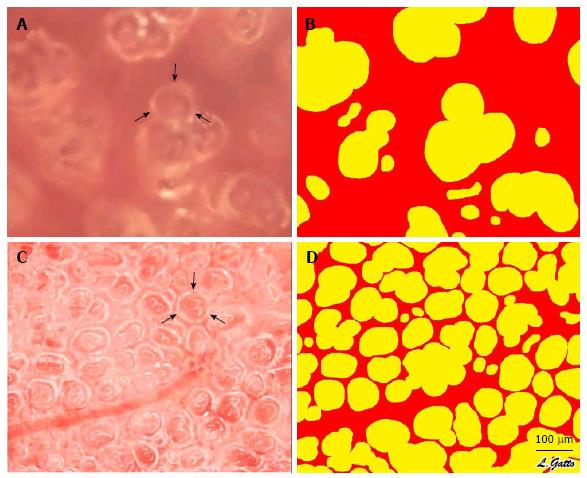
Figure 6 In vivo photomicrographs and image analysis of inflated subpleural alveoli in the volume cycled ventilation (A, B) and airway pressure release ventilation (C, D) groups.
Measurement of the % Air Space was accomplished by circling the inflated alveoli using computer image analysis. All inflated alveoli were then assigned the color yellow and noninflated areas were assigned the color red generating a sharp contrast for the image analysis software to identify and measure the % of inflated alveoli/microscopic field. Arrows (A, C) identify a single alveolus (with permission)[35]. VC: Volume cycled ventilation.
- Citation: Nieman GF, Gatto LA, Habashi NM. Reducing acute respiratory distress syndrome occurrence using mechanical ventilation. World J Respirol 2015; 5(3): 188-198
- URL: https://www.wjgnet.com/2218-6255/full/v5/i3/188.htm
- DOI: https://dx.doi.org/10.5320/wjr.v5.i3.188


