Copyright
©2013 Baishideng.
World J Otorhinolaryngol. Feb 28, 2013; 3(1): 1-15
Published online Feb 28, 2013. doi: 10.5319/wjo.v3.i1.1
Published online Feb 28, 2013. doi: 10.5319/wjo.v3.i1.1
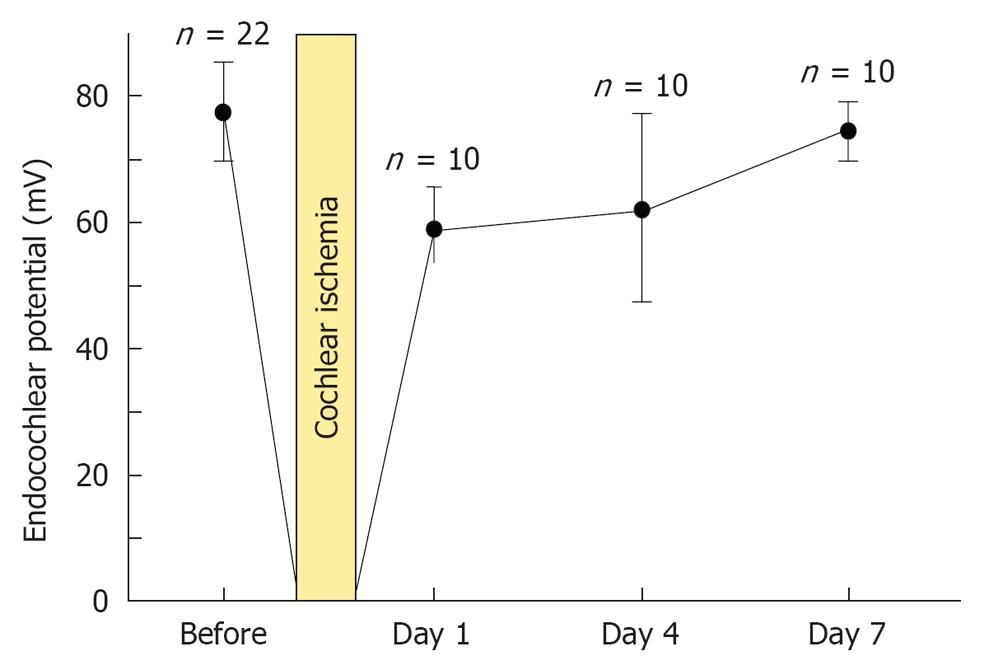
Figure 5 Sequential changes in endocochlear potential after transient cochlear ischemia.
Each point indicates the mean voltage of the endocochlear potential. Vertical bars show one standard deviation. Originated from[16], with permission.
- Citation: Gyo K. Experimental study of transient cochlear ischemia as a cause of sudden deafness. World J Otorhinolaryngol 2013; 3(1): 1-15
- URL: https://www.wjgnet.com/2218-6247/full/v3/i1/1.htm
- DOI: https://dx.doi.org/10.5319/wjo.v3.i1.1


