Copyright
©The Author(s) 2015.
World J Neurol. Dec 28, 2015; 5(4): 113-131
Published online Dec 28, 2015. doi: 10.5316/wjn.v5.i4.113
Published online Dec 28, 2015. doi: 10.5316/wjn.v5.i4.113
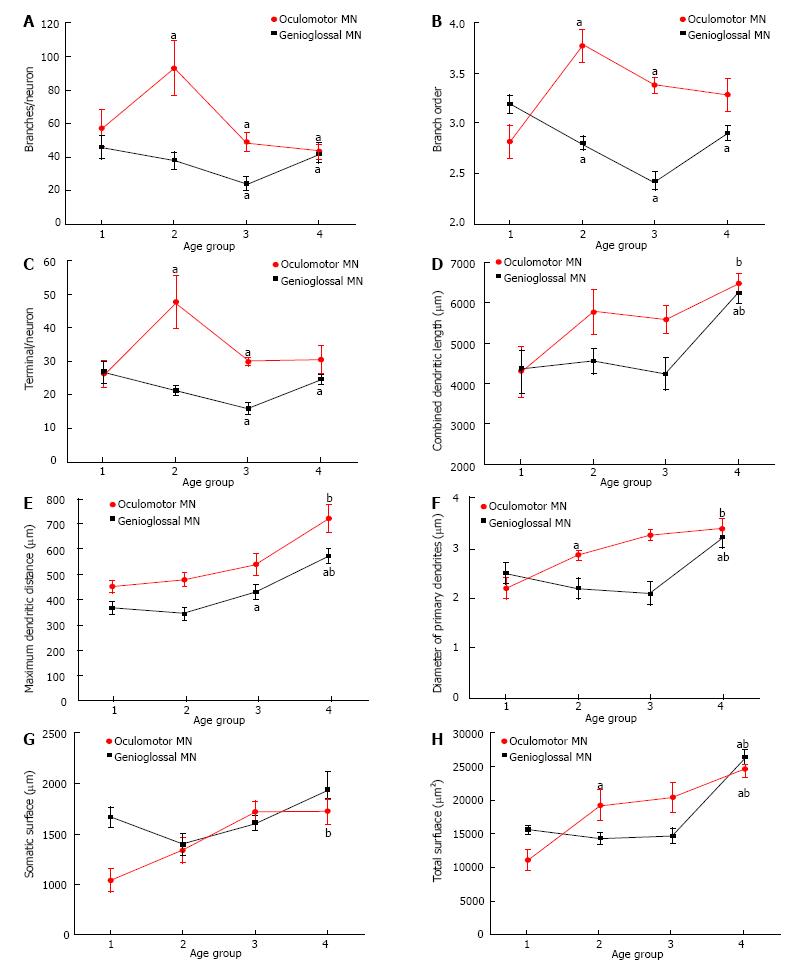
Figure 1 Postnatal maturation of morphological properties of motoneurons from genioglossal and oculomotor nuclei.
A-C: Changes in dendritic complexity measured as number of branches per neuron (A), branch order (B) and number of terminals per neuron (C). Note that in GG MNs complexity decreases up to P15 and then increases, while in OCM MNs there is an increase up to P10 and then decreases. The 2 opposite development strategies lead to the same outcome in the adult rat when compared with initial values; D and E: Changes in neuronal length measured as combined dendritic length (D) and maximum distance from soma to dendritic terminal (E). Note in D-E that dendritic length progressively increases for both populations of MNs with the most relevant changes at the late stages of development; F and H: Changes in neuronal size measured as diameter of primary dendrites (F), somatic surface (G) and total surface area (H). Note that in F and H OCM MNs grow between P1 and P10, while GG MNs increase mainly between P15 and P30. OCM MNs show a slow growth of the somatic surface along development, while it is already established at birth in the case of GG MNs. In this figure and the following: (1) the plots illustrate mean values for each parameter and age for OCM (red circle) and GG (black square) MNs; (2) measures are expressed in mean ± standard error; (3) the “a“ indicates statistical significance between two consecutive age groups; and (4) the “b“ represents statistical significance between age group 1 and age group 4. The age groups 1, 2, 3 and 4 correspond to P1-P5, P6-P10, P11-P15 and P21-P30, respectively. The data from GG[5,7] and OCM[11] come from previous studies. MNs: Motoneurons; GG: Genioglossal; OCM: Oculomotor.
- Citation: Carrascal L, Nieto-González J, Pardillo-Díaz R, Pásaro R, Barrionuevo G, Torres B, Cameron WE, Núñez-Abades P. Time windows for postnatal changes in morphology and membrane excitability of genioglossal and oculomotor motoneurons. World J Neurol 2015; 5(4): 113-131
- URL: https://www.wjgnet.com/2218-6212/full/v5/i4/113.htm
- DOI: https://dx.doi.org/10.5316/wjn.v5.i4.113


