Copyright
©2013 Baishideng.
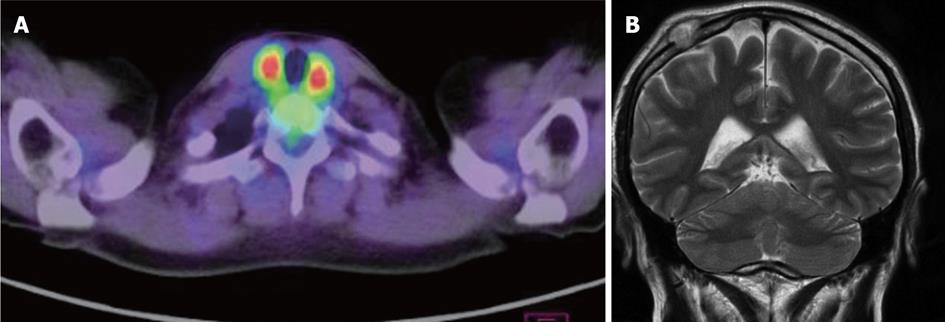
Figure 2 langerhans cell histiocytosis thyroid (A) and skull (B) lesions.
A: Positron emission tomography scan shows hot spots (SUVmax = 7.0) at both lobes of thyroid; B: Magnetic resonance imaging (T2W2) shows a mass at the right parietal region.
- Citation: Imashuku S, Shimazaki C, Tojo A, Imamura T, Morimoto A. Management of adult Langerhans cell histiocytosis based on the characteristic clinical features. World J Hematol 2013; 2(3): 89-98
- URL: https://www.wjgnet.com/2218-6204/full/v2/i3/89.htm
- DOI: https://dx.doi.org/10.5315/wjh.v2.i3.89


