Copyright
©2014 Baishideng Publishing Group Co.
World J Anesthesiol. Mar 27, 2014; 3(1): 96-104
Published online Mar 27, 2014. doi: 10.5313/wja.v3.i1.96
Published online Mar 27, 2014. doi: 10.5313/wja.v3.i1.96
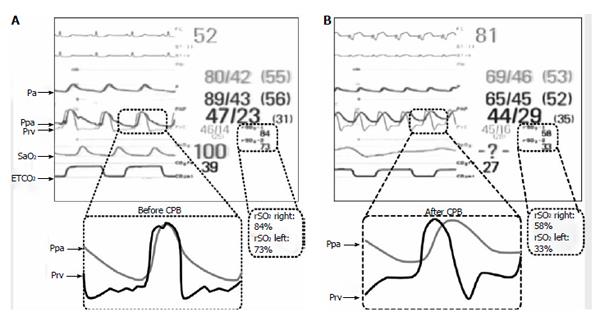
Figure 6 Hemodynamic waveforms combined with regional near infrared spectroscopy values obtained before (A) and after cardiopulmonary bypass (B).
The upper near infrared spectroscopy (NIRS) value was obtained from the right lower extremity and the lower NIRS value is from the brain. Note that after cardiopulmonary bypass (CPB), both values were reduced significantly. This was associated with failure to wean from CPB and significant hemodynamic instability. The etiology was a result of acute right ventricular (RV) failure, demonstrated on the right ventricular pressure (Prv) waveform. Note the change Prv from a normal shape before CPB to a square root sign, with diastolic equalisation after CPB. Note also that the pulmonary artery pressure (Ppa) systolic values were lower after CPB and non diagnostic of acute RV failure. The right atrial pressure was 16 mmHg compared to 14 mmHg before CPB. ETCO2: End-tidal carbon dioxide; Paf: Femoral arterial pressure; Par: Radial arterial pressure; SaO2: Oxygen saturation. With permission from Wolters Kluwer Health, Lippincott Williams and Wilkins adapt from reference[44].
- Citation: Denault AY, Couture P. Practical diastology. World J Anesthesiol 2014; 3(1): 96-104
- URL: https://www.wjgnet.com/2218-6182/full/v3/i1/96.htm
- DOI: https://dx.doi.org/10.5313/wja.v3.i1.96


