Copyright
©2013 Baishideng Publishing Group Co.
World J Orthop. Oct 18, 2013; 4(4): 267-278
Published online Oct 18, 2013. doi: 10.5312/wjo.v4.i4.267
Published online Oct 18, 2013. doi: 10.5312/wjo.v4.i4.267
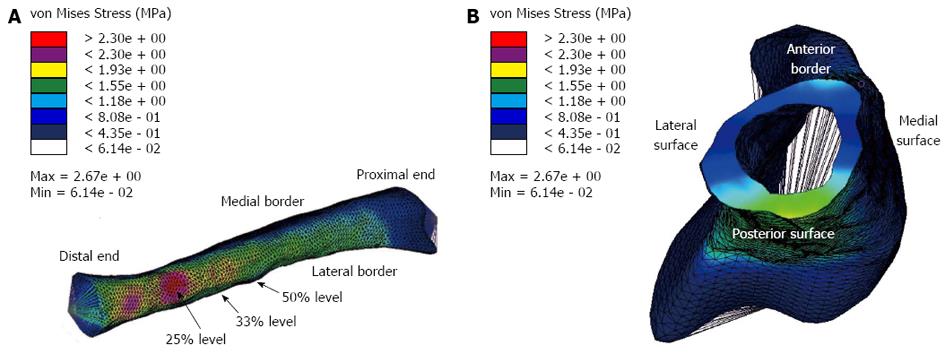
Figure 9 Rabbit finite element model showing the von Mises stresses.
A: Posterior view: High stresses were found along the posterior surface; these were most prominent around 25% level, which is shown in red; B: A section through the 50% level. The highest stress (which is compressive) is on the posterior surface, which is consistent with the stress results presented in Figure 8B.
- Citation: Franklyn M, Field B. Experimental and finite element analysis of tibial stress fractures using a rabbit model. World J Orthop 2013; 4(4): 267-278
- URL: https://www.wjgnet.com/2218-5836/full/v4/i4/267.htm
- DOI: https://dx.doi.org/10.5312/wjo.v4.i4.267


