Copyright
©The Author(s) 2016.
World J Clin Oncol. Apr 10, 2016; 7(2): 160-173
Published online Apr 10, 2016. doi: 10.5306/wjco.v7.i2.160
Published online Apr 10, 2016. doi: 10.5306/wjco.v7.i2.160
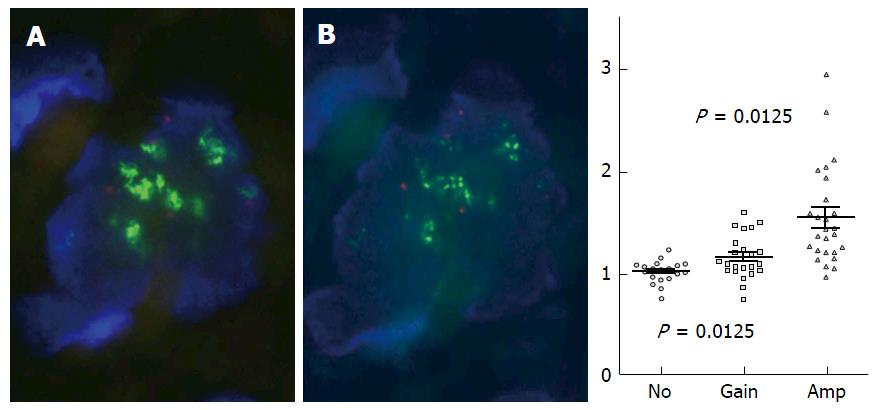
Figure 6 Effect of RNase treatment on fluorescence in situ hybridization signal patterns.
RNase pretreatment resulted in a higher fraction of tumor cells that showed point-shaped fluorescence in situ hybridization (FISH) signals, when fuzzy clouds of estrogen receptor alpha gene (ESR1) signals detected by standard FISH were eliminated (A). ESR1 copy number ratios determined by multiplex ligation-dependent probe amplification (MLPA) (y-axis) of “not increased”ESR1 copy number (no), ESR1 copy number gain (gain) and ESR1 amplification (amp) determined by FISH (x-axis) according to ERBB2 (HER2) testing criteria (B). Results suggest an association of increased DNA copies of ESR1 determined by MLPA with increased ESR1 signals detected by FISH (B). MLPA ratios of groups “no” and “amp” as well as of “no” and “gain” are significantly different (see dot plot). Modified from Moelans et al[40].
- Citation: Holst F. Estrogen receptor alpha gene amplification in breast cancer: 25 years of debate. World J Clin Oncol 2016; 7(2): 160-173
- URL: https://www.wjgnet.com/2218-4333/full/v7/i2/160.htm
- DOI: https://dx.doi.org/10.5306/wjco.v7.i2.160


