Copyright
©The Author(s) 2016.
World J Clin Oncol. Apr 10, 2016; 7(2): 160-173
Published online Apr 10, 2016. doi: 10.5306/wjco.v7.i2.160
Published online Apr 10, 2016. doi: 10.5306/wjco.v7.i2.160
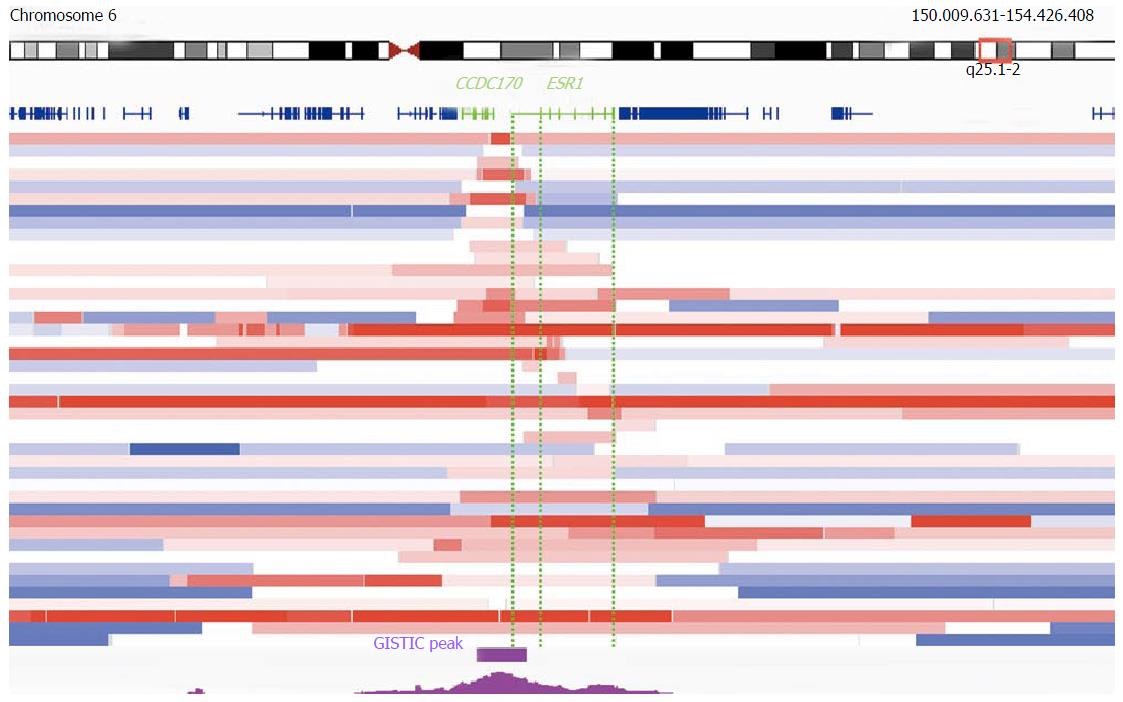
Figure 4 Architecture of the most focal estrogen receptor alpha gene amplifications in The Cancer Genome Atlas.
Segmented log2 gene copy number ratios in 43 TCGA breast cancers are represented as horizontal bars (red: increased, white: neutral/normal, blue: decreased/deleted). Focal amplifications within and smaller than the region that is 2 Mb up and downstream of estrogen receptor alpha gene (ESR1) (150.009.631-154.426.408 bp) and that harbor any amplified ESR1 sequences in relation to their flanking regions are shown. The 19 cases at the top of the figure show amplifications that overlap any CCDC170 sequences and only parts of ESR1. In the lower 24 cases, the amplicon includes either the full ESR1 sequence, or parts of ESR1 without overlapping CCDC170. Positions of genes are indicated in dark blue; ESR1 as well as CCDC170 are highlighted in green. Dotted green lines indicate regions of ESR1 with (right) or without (left) translated exons. The position of the GISTIC-log10 q-value peak is indicated in magenta. The position of the significant GISTIC q-value (< 0.25) region is indicated as a separate magenta colored bar (95%CI)[52,83,86]. TCGA: The Cancer Genome Atlas; GISTIC: Genomic Identification of Significant Targets in Cancer.
- Citation: Holst F. Estrogen receptor alpha gene amplification in breast cancer: 25 years of debate. World J Clin Oncol 2016; 7(2): 160-173
- URL: https://www.wjgnet.com/2218-4333/full/v7/i2/160.htm
- DOI: https://dx.doi.org/10.5306/wjco.v7.i2.160


