Copyright
©The Author(s) 2016.
World J Clin Oncol. Apr 10, 2016; 7(2): 160-173
Published online Apr 10, 2016. doi: 10.5306/wjco.v7.i2.160
Published online Apr 10, 2016. doi: 10.5306/wjco.v7.i2.160
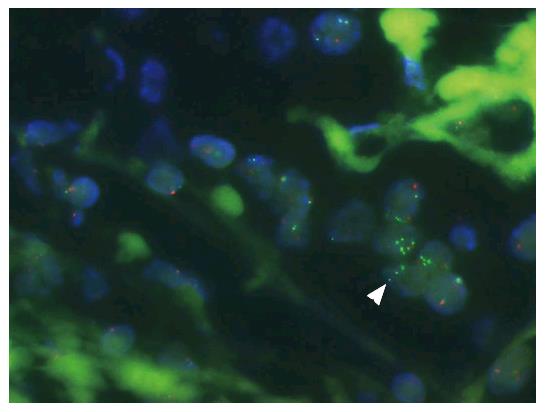
Figure 2 Heterogeneous estrogen receptor alpha gene amplification detected by fluorescence in situ hybridization analysis.
Green and red spots represent estrogen receptor alpha gene (ESR1) gene probe and centromere 6 probe, respectively. White arrowhead points to tumor cell nuclei (blue) with increased numbers of ESR1 fluorescence in situ hybridization signals next to tumor cell nuclei without increased numbers of signals. From Moelans et al[40].
- Citation: Holst F. Estrogen receptor alpha gene amplification in breast cancer: 25 years of debate. World J Clin Oncol 2016; 7(2): 160-173
- URL: https://www.wjgnet.com/2218-4333/full/v7/i2/160.htm
- DOI: https://dx.doi.org/10.5306/wjco.v7.i2.160


