Copyright
©2014 Baishideng Publishing Group Inc.
World J Clin Oncol. Oct 10, 2014; 5(4): 764-774
Published online Oct 10, 2014. doi: 10.5306/wjco.v5.i4.764
Published online Oct 10, 2014. doi: 10.5306/wjco.v5.i4.764
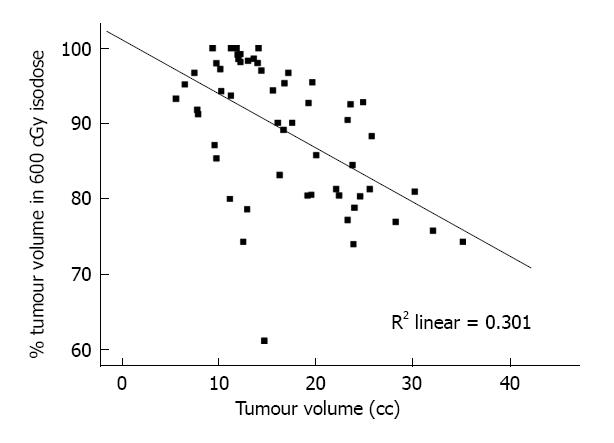
Figure 4 Scatter-plot for tumour volume vs percentage of tumour enclosed within the 6 Gy isodose lines.
Reproduced with permission[28].
- Citation: Srivastava A, Datta NR. Brachytherapy in cancer cervix: Time to move ahead from point A? World J Clin Oncol 2014; 5(4): 764-774
- URL: https://www.wjgnet.com/2218-4333/full/v5/i4/764.htm
- DOI: https://dx.doi.org/10.5306/wjco.v5.i4.764


