Copyright
©2012 Baishideng Publishing Group Co.
World J Radiol. Aug 28, 2012; 4(8): 353-371
Published online Aug 28, 2012. doi: 10.4329/wjr.v4.i8.353
Published online Aug 28, 2012. doi: 10.4329/wjr.v4.i8.353
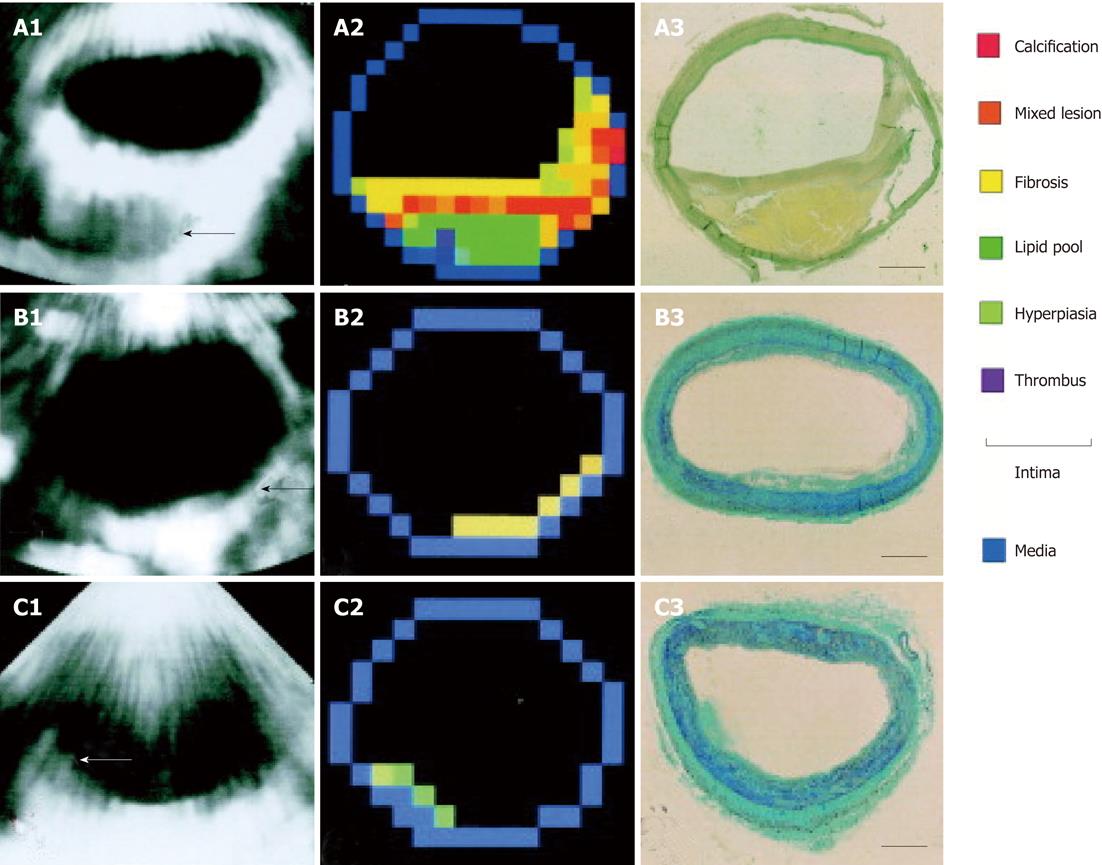
Figure 3 Example of plaque characterization trough integrated backscatter ultrasonography.
A: Large plaque (arrow); A1: An integrated backscatter (IB) image at autopsy; A2: A color-coded map constructed from A1, based on the five IB categories and conventional 2D echo findings; A3: van Gieson staining of the same segment as the IB measurement (bar = 1 mm); B: Intimal fibrosis (arrow); B1: An IB image during life; B2: A color-coded map constructed from B1; B3: Masson’s trichrome staining of the same segment; C: Intimal hyperplasia consisting of smooth muscle cells (arrow); C1: An integrated backscatter image during life; C2: A color-coded map constructed from C1; C3: Masson’s trichrome staining of the same segment (reprint with permission)[32].
- Citation: Soloperto G, Casciaro S. Progress in atherosclerotic plaque imaging. World J Radiol 2012; 4(8): 353-371
- URL: https://www.wjgnet.com/1949-8470/full/v4/i8/353.htm
- DOI: https://dx.doi.org/10.4329/wjr.v4.i8.353


