Copyright
©2010 Baishideng Publishing Group Co.
World J Radiol. Jun 28, 2010; 2(6): 215-223
Published online Jun 28, 2010. doi: 10.4329/wjr.v2.i6.215
Published online Jun 28, 2010. doi: 10.4329/wjr.v2.i6.215
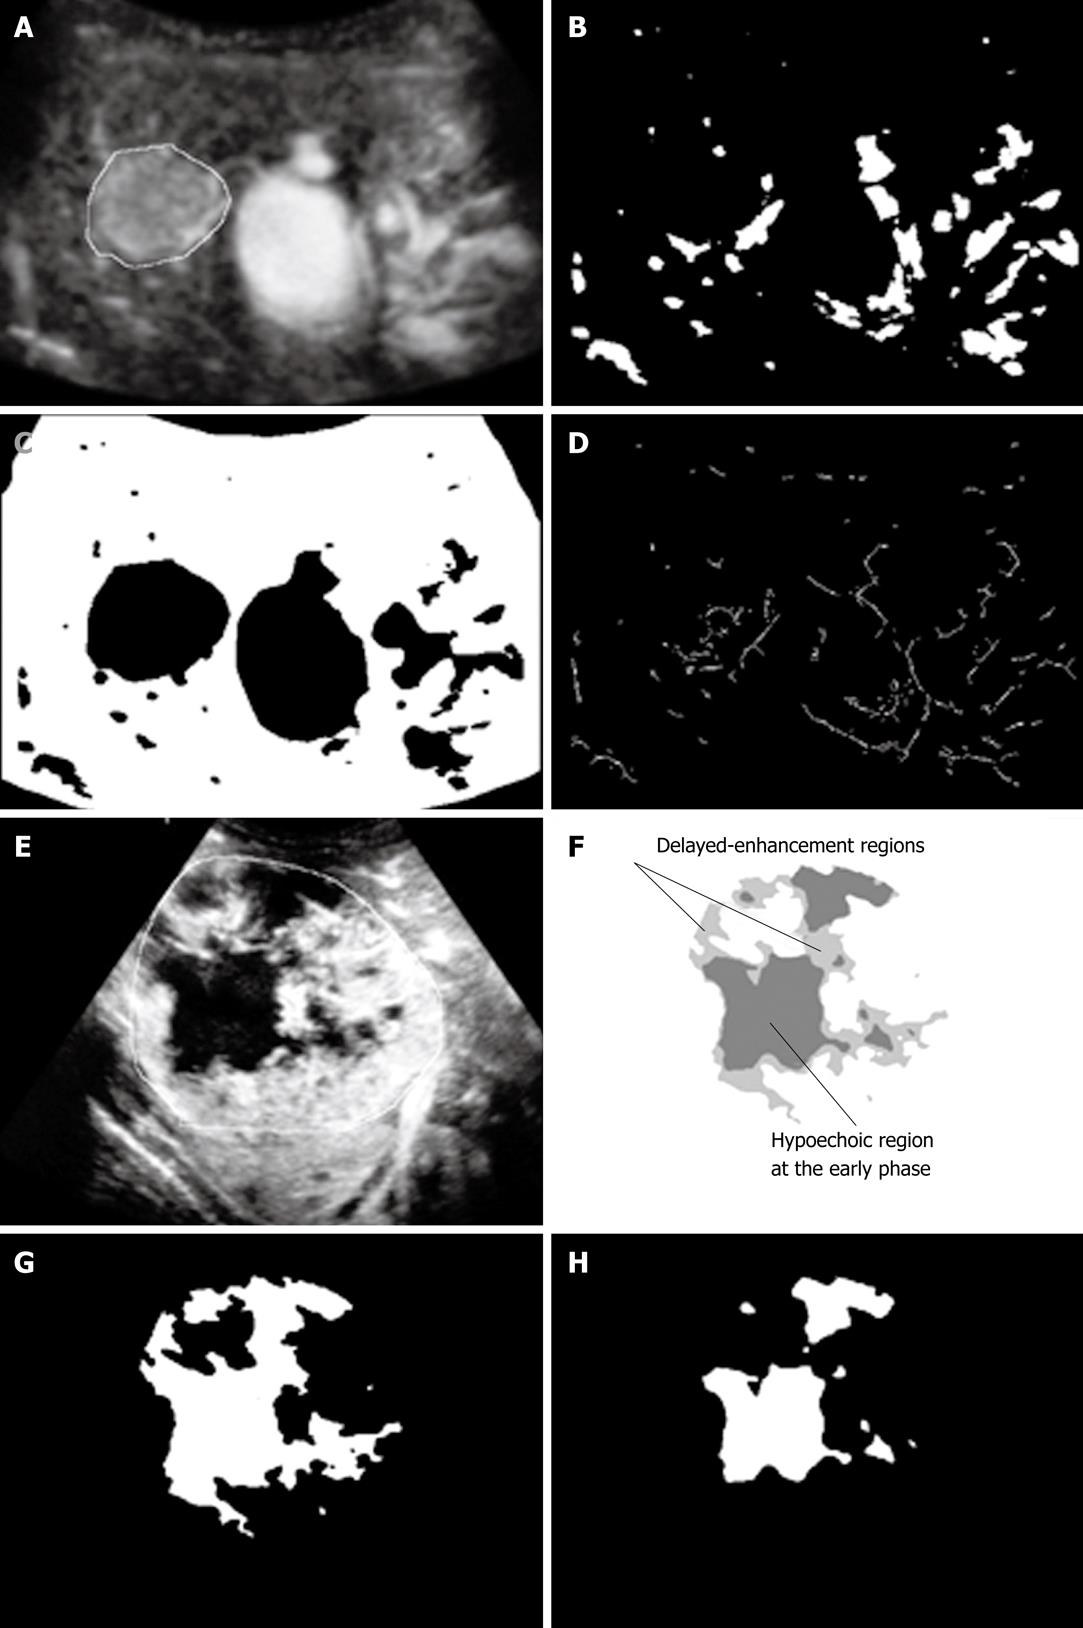
Figure 3 Extraction of morphologic and gray-level image features.
A: Original MFI image at the early phase including one FLL (shown as the contour) and a portal vein; B: Vessel-like pattern enhanced image; C: Segmented adjacent liver parenchyma regions obtained from the original MFI image; D: Skeleton of vessel-like pattern enhanced image for estimating the average size of vessel-like patterns on the MFI image; Example of original MFI image at the delayed phase (E) and its segmented images for hyperechoic regions at the early (G) and delayed phase (H). The difference in the regions between two images at two phases was defined as delayed-enhancement region (F). Please note that we defined an “early phase” and a “delayed phase” in the MFI as a replenishment time for reaching 50% and 98% of the maximum average pixel value within a FLL, respectively. MFI: Micro-flow imaging. Reproduced, with modification, from Shiraishi et al[32], Med Phys 2008; 35: 1734-1746.
- Citation: Sugimoto K, Shiraishi J, Moriyasu F, Doi K. Computer-aided diagnosis for contrast-enhanced ultrasound in the liver. World J Radiol 2010; 2(6): 215-223
- URL: https://www.wjgnet.com/1949-8470/full/v2/i6/215.htm
- DOI: https://dx.doi.org/10.4329/wjr.v2.i6.215


