Copyright
©2010 Baishideng Publishing Group Co.
World J Radiol. Apr 28, 2010; 2(4): 135-142
Published online Apr 28, 2010. doi: 10.4329/wjr.v2.i4.135
Published online Apr 28, 2010. doi: 10.4329/wjr.v2.i4.135
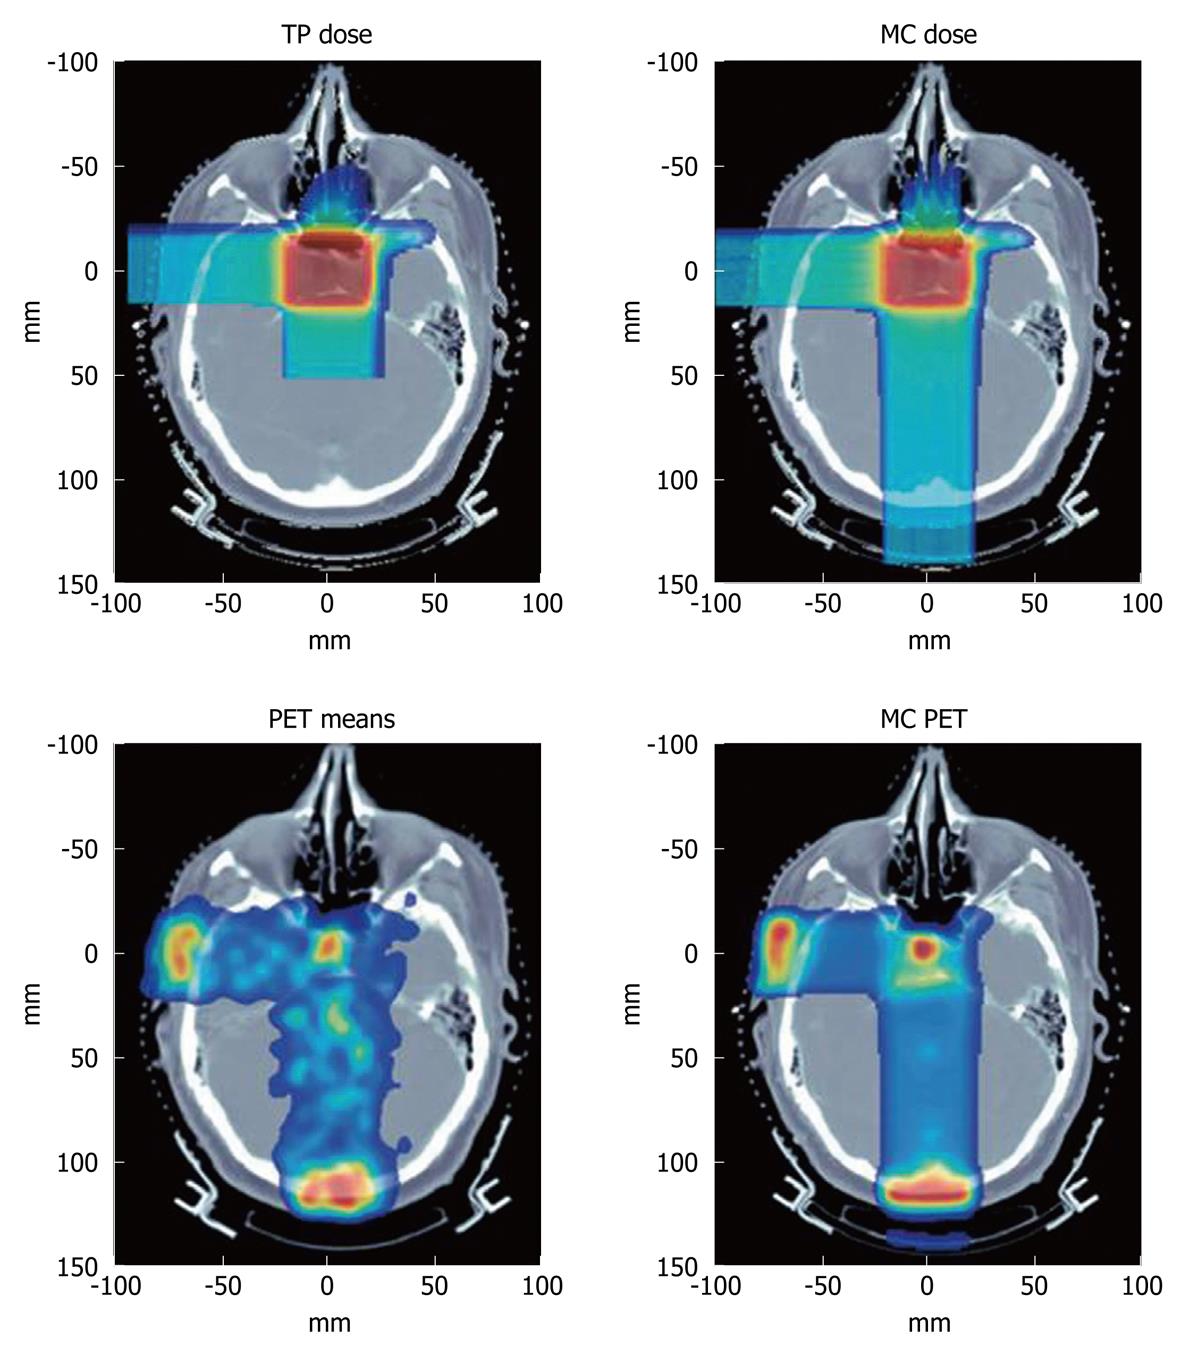
Figure 4 Top: Treatment plan (TP) and Monte Carlo (MC) dose for a patient with pituitary adenoma receiving two orthogonal fields.
Bottom: Measured and Monte Carlo PET images. Delay times from the beginning of imaging were about 26 and 18 min from the end of the first and second field applications, respectively. Range of color wash is from blue (minimum) to red (maximum) (Reprinted from[34] with permission from Elsevier Limited).
- Citation: Studenski MT, Xiao Y. Proton therapy dosimetry using positron emission tomography. World J Radiol 2010; 2(4): 135-142
- URL: https://www.wjgnet.com/1949-8470/full/v2/i4/135.htm
- DOI: https://dx.doi.org/10.4329/wjr.v2.i4.135


