Copyright
©2010 Baishideng Publishing Group Co.
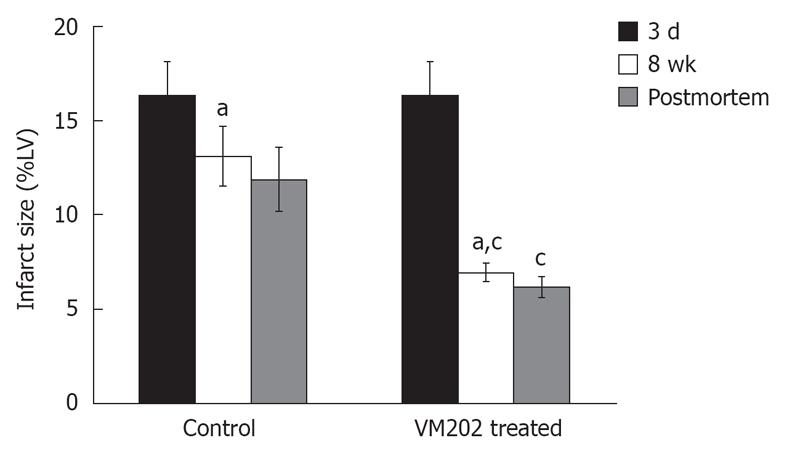
Figure 4 Histogram shows the difference in infarct size prior to intramyocardial gene delivery at 3 d and 8 wk after infarction in control animals (left block) and animals treated with hepatocyte growth factor gene (VM202) (right block) measured on DE-MR imaging (black and white bars) and postmortem (gray bars).
Note the decline in infarct size was greater in gene treated animals compared with control animals. aP < 0.05 compared with 3 d acute infarction. cP < 0.05 compared with 8 wk chronic infarction in control animals. %LV: Percentage of LV mass[59].
- Citation: Saeed M, Hetts S, Wilson M. Reperfusion injury components and manifestations determined by cardiovascular MR and MDCT imaging. World J Radiol 2010; 2(1): 1-14
- URL: https://www.wjgnet.com/1949-8470/full/v2/i1/1.htm
- DOI: https://dx.doi.org/10.4329/wjr.v2.i1.1


