Copyright
©The Author(s) 2021.
World J Radiol. Sep 28, 2021; 13(9): 258-282
Published online Sep 28, 2021. doi: 10.4329/wjr.v13.i9.258
Published online Sep 28, 2021. doi: 10.4329/wjr.v13.i9.258
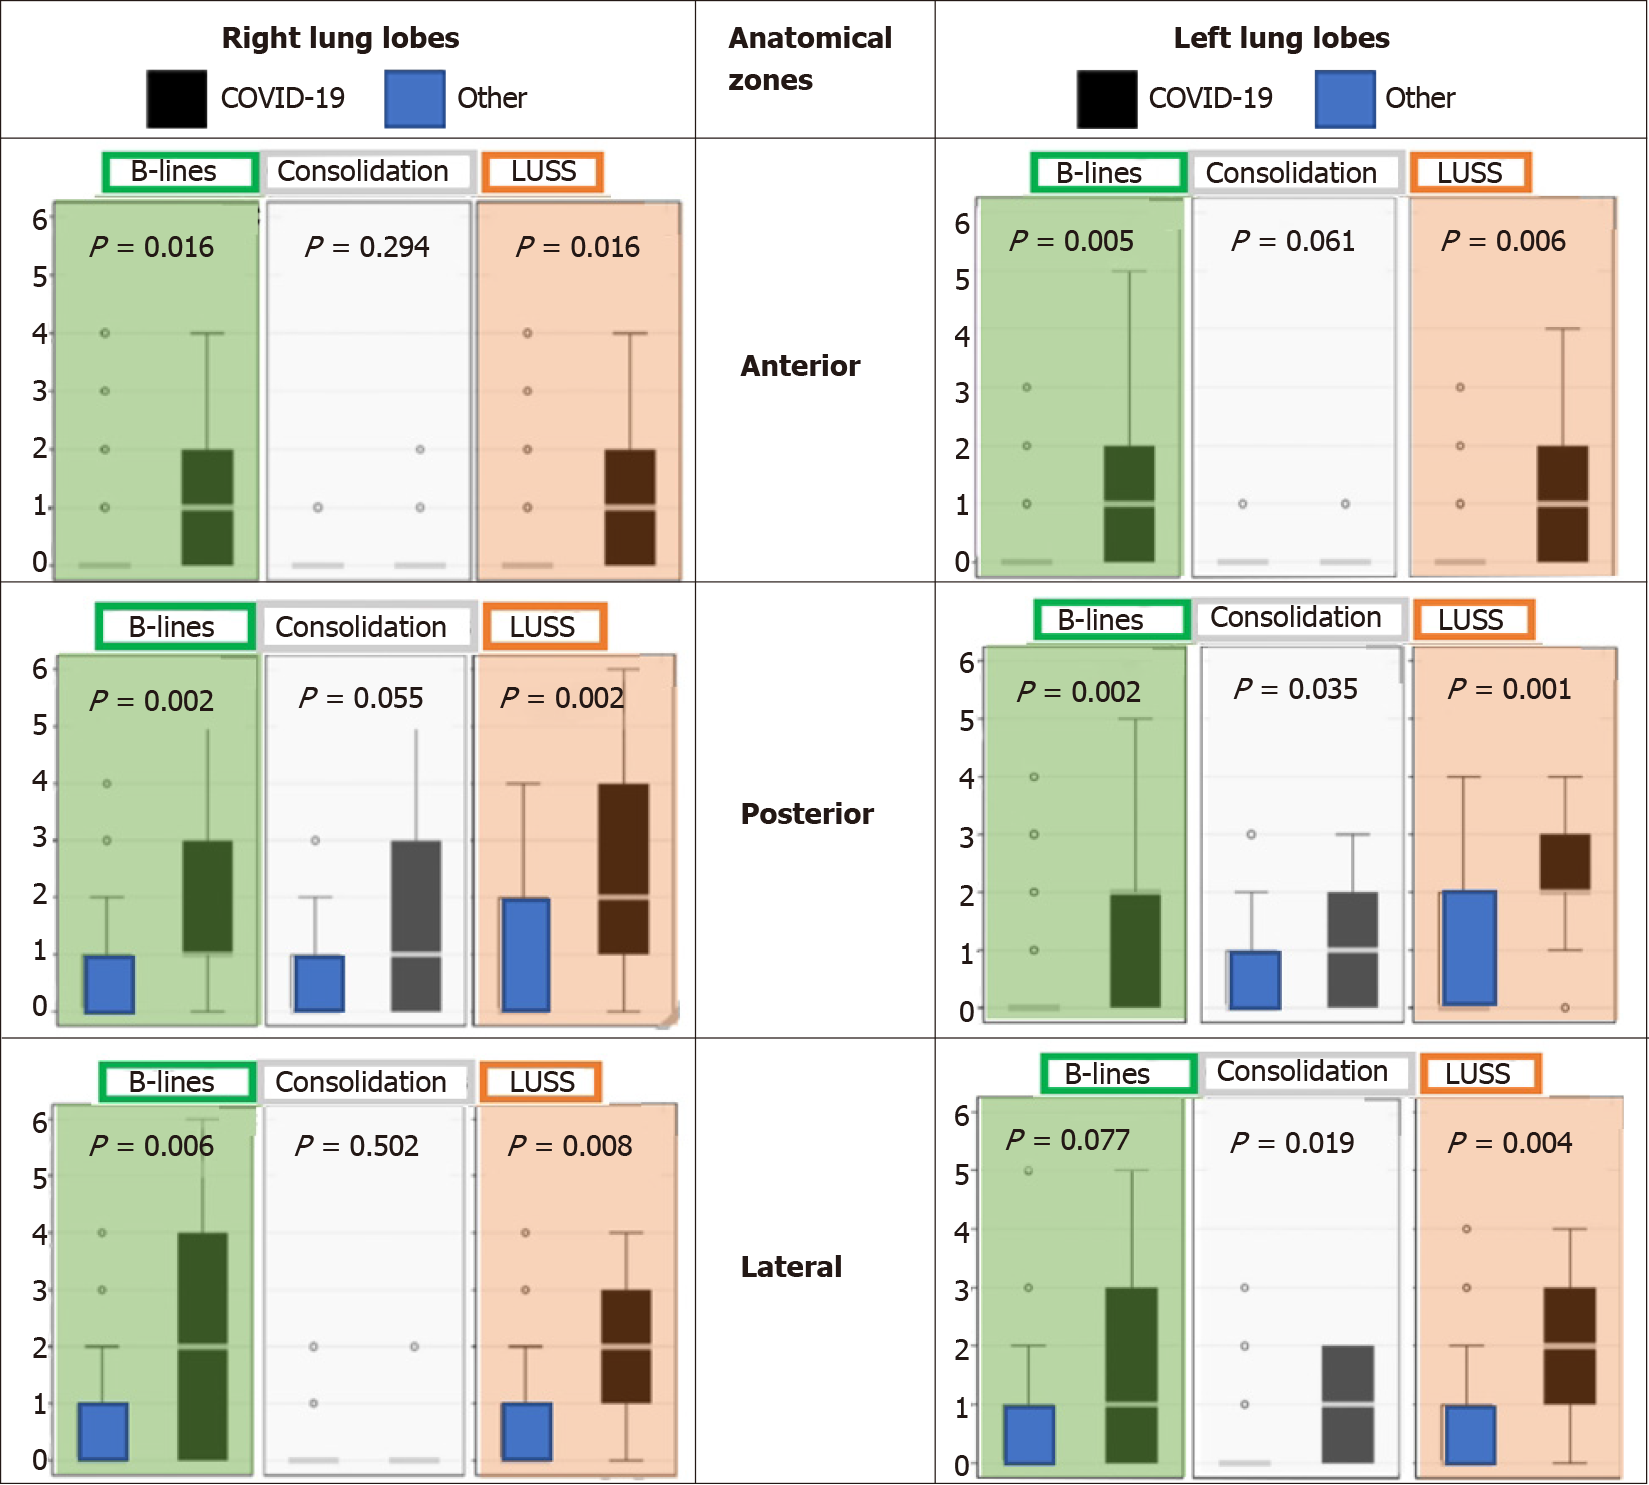
Figure 11 Lung ultrasonography presentation of B-lines (green panel), subpleural consolidations (white panel), and lung ultrasound scores (orange panel) at different lung zones (anterior, lateral, posterior) in patients with a primary diagnosis of coronavirus disease 2019 (n = 11) and without coronavirus disease 2019 (other, n = 38).
Boxplots around median and interquartile range (IQR), with outliers within 1.5 IQR of the nearest quartile. Other (extrapulmonary infection/inflammation (n = 10), pneumonia of other etiology (n = 8), exacerbated asthma/ chronic obstructive pulmonary disease (n = 7), pulmonary neoplasia (n = 4), pulmonary embolism (n = 2), congestive heart failure (n = 2), and not documented (n = 5)). Statistically significant outcomes with P < 0.05. Data utilized from Speidel et al[67]. COVID-19: Coronavirus disease 2019; LUSS: Lung ultrasound score.
- Citation: Pal A, Ali A, Young TR, Oostenbrink J, Prabhakar A, Prabhakar A, Deacon N, Arnold A, Eltayeb A, Yap C, Young DM, Tang A, Lakshmanan S, Lim YY, Pokarowski M, Kakodkar P. Comprehensive literature review on the radiographic findings, imaging modalities, and the role of radiology in the COVID-19 pandemic. World J Radiol 2021; 13(9): 258-282
- URL: https://www.wjgnet.com/1949-8470/full/v13/i9/258.htm
- DOI: https://dx.doi.org/10.4329/wjr.v13.i9.258


