Copyright
©The Author(s) 2017.
World J Cardiol. Mar 26, 2017; 9(3): 230-240
Published online Mar 26, 2017. doi: 10.4330/wjc.v9.i3.230
Published online Mar 26, 2017. doi: 10.4330/wjc.v9.i3.230
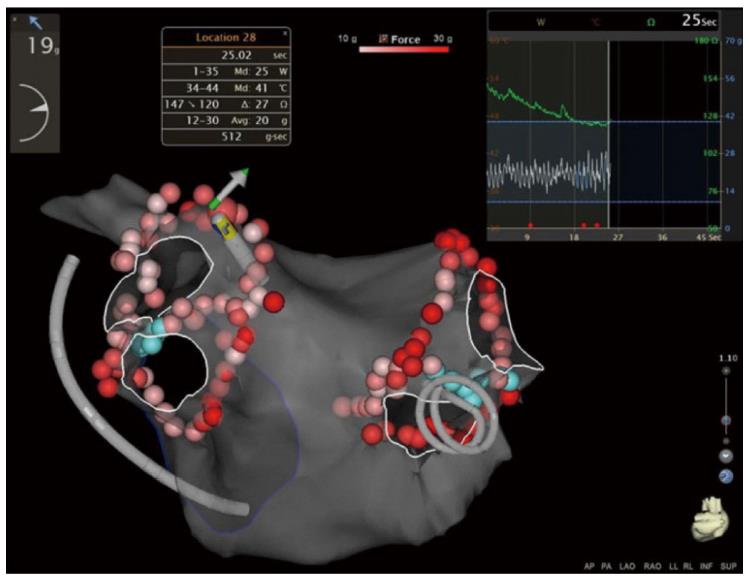
Figure 2 Automatic tagging of radiofrequency lesions.
The contact force (CF) of each application is color-coded (color bar). The manually acquired RF applications are displayed in green. The central box shows the information collected by the VisiTagTM module on each point, including average CF, time, force-time integral, temperature, power, and delta impedance. The force and impedance graphs from this RF point are shown on the right, and the real-time CF and direction dashboard are shown on the left. Reproduced with permission from Pedrote et al[24]. RF: Radiofrequency.
- Citation: Pedrote A, Acosta J, Jáuregui-Garrido B, Frutos-López M, Arana-Rueda E. Paroxysmal atrial fibrillation ablation: Achieving permanent pulmonary vein isolation by point-by-point radiofrequency lesions. World J Cardiol 2017; 9(3): 230-240
- URL: https://www.wjgnet.com/1949-8462/full/v9/i3/230.htm
- DOI: https://dx.doi.org/10.4330/wjc.v9.i3.230


